. 2018 Jan;18(1):10.1002/mabi.201700194.
doi: 10.1002/mabi.201700194. Epub 2017 Aug 4.

Synthesis and Evaluation of Chloroquine-Containing DMAEMA Copolymers as Efficient Anti-miRNA Delivery Vectors with Improved Endosomal Escape and Antimigratory Activity in Cancer Cells

Affiliations

Synthesis and Evaluation of Chloroquine-Containing DMAEMA Copolymers as Efficient Anti-miRNA Delivery Vectors with Improved Endosomal Escape and Antimigratory Activity in Cancer Cells

Ying Xie et al. Macromol Biosci. 2018 Jan.

Abstract

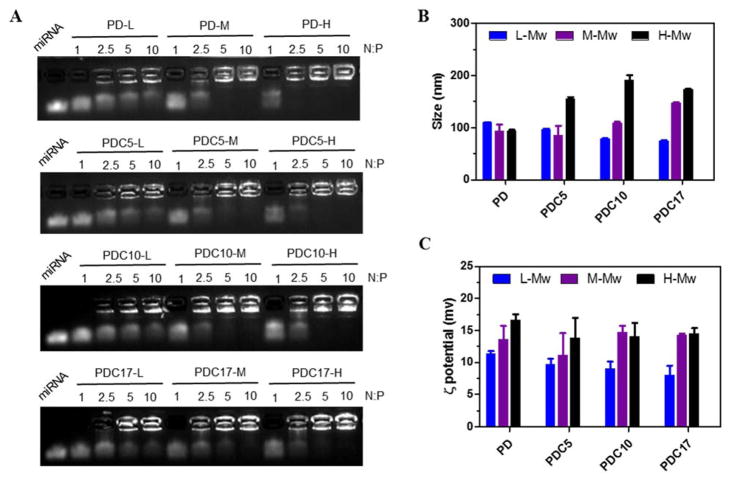
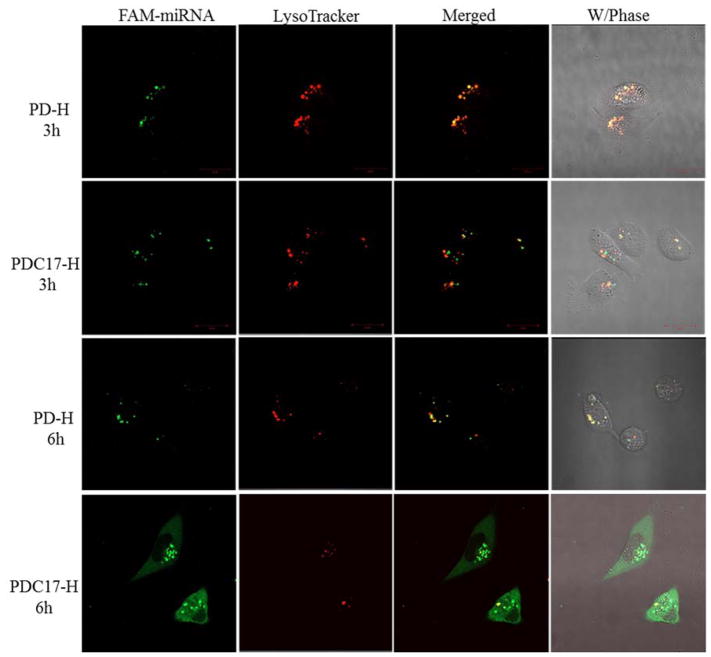
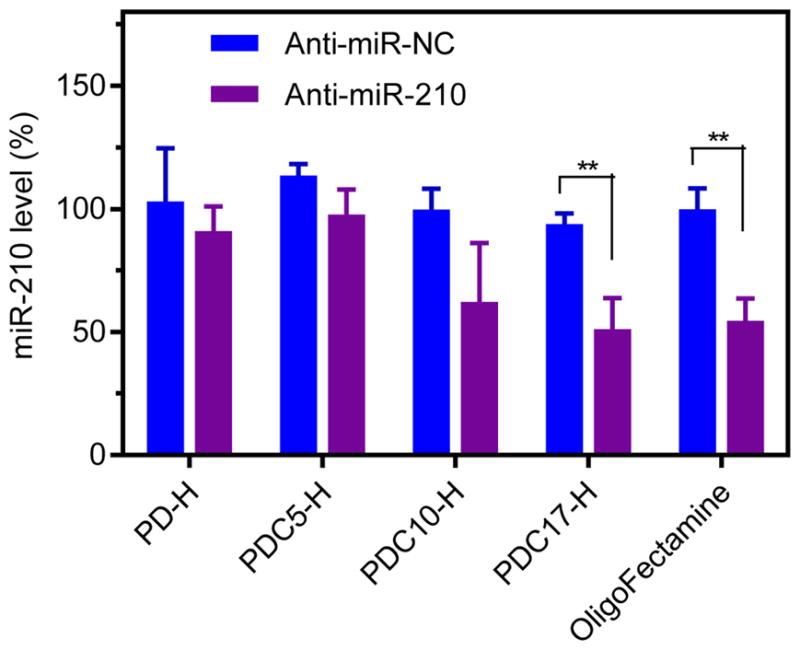
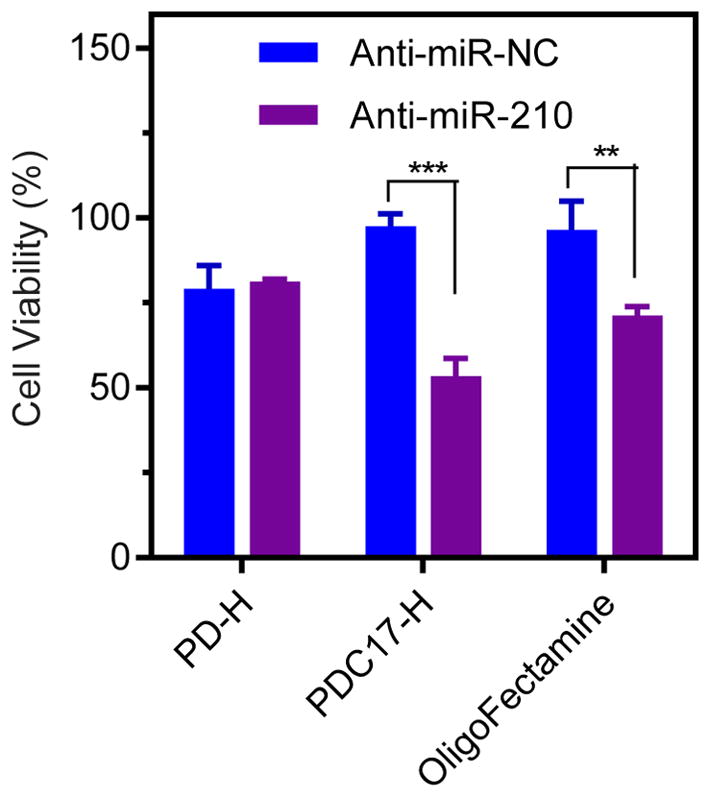
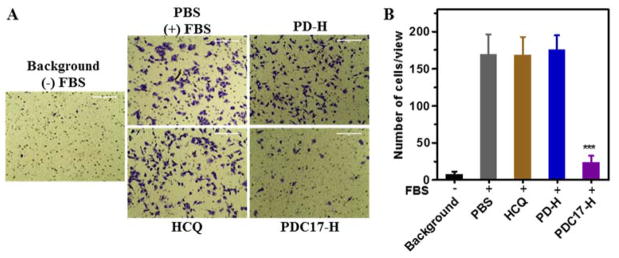
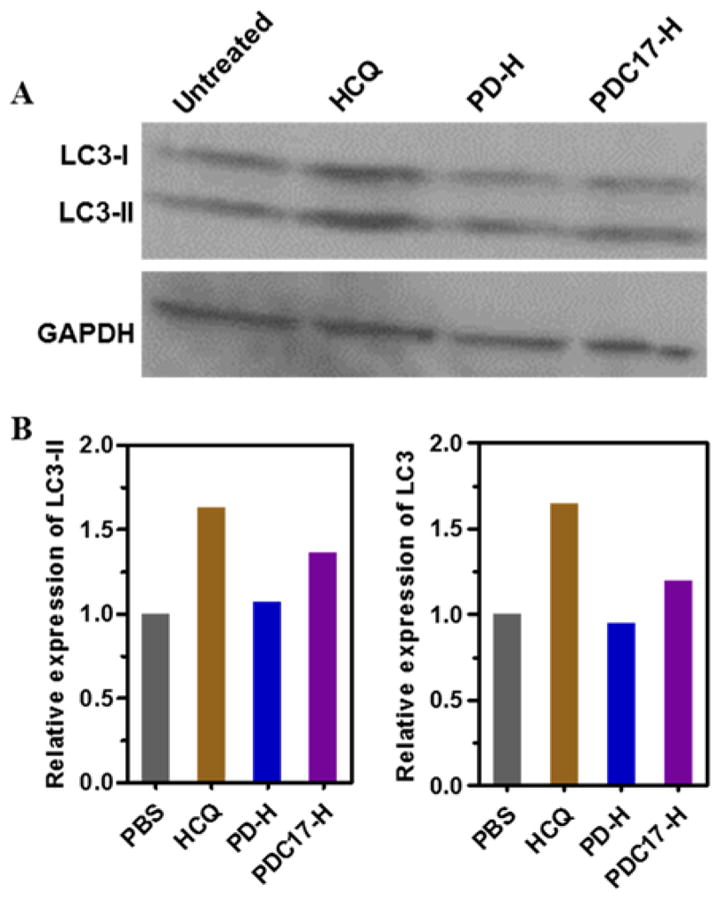
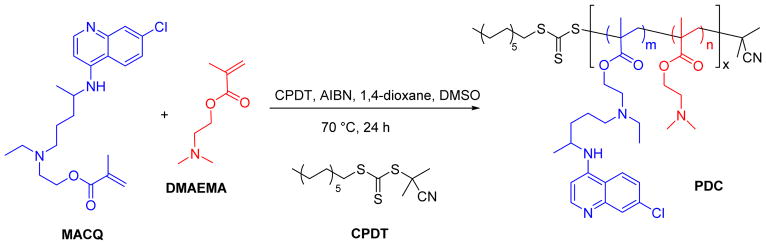
Chloroquine-containing 2-(dimethylamino)ethyl methacrylate copolymers (PDCs) are synthesized by reversible addition-fragmentation chain-transfer polymerization. Systematic evaluation is performed to test the hypothesis that presence of chloroquine (CQ) in the PDC structure will improve miRNA delivery due to enhanced endosomal escape while simultaneously contribute to anticancer activity of PDC/miRNA polyplexes through inhibition of cancer cell migration. The results show that miRNA delivery efficiency is dependent both on the molecular weight and CQ. The best performing PDC/miRNA polyplexes show effective endosomal escape of miRNA. PDC polyplexes with therapeutic miR-210 show promising anticancer activity in human breast cancer cells. PDC/miRNA polyplexes show excellent ability to inhibit migration of cancer cells. Overall, this study supports the use of PDC as a promising polymeric drug platform for use in combination anti-metastatic and anticancer miRNA therapeutic strategies.

Keywords: chloroquine; endosomal escape; miRNA delivery; polymeric drug; polyplex.


Figures

Figure 1
Figure 1
Representative 1H-NMR of PD-H and PDC17-H.
Figure 2
Figure 2
Physicochemical characterization of miRNA polyplexes. (A) miRNA condensation by PD and PDC using agarose gel electrophoresis. (B) Hydrodynamic size and (C) ζ potential of polyplexes at N:P 10 (n=3).
Figure 3
Figure 3
Cytotoxicity of polymers. (A) Cell viability of the polymers determined using Cell Titer-Blue Assay in MDA-MB-231 cells. Results are shown as mean cell viability ± SD (n = 3). (B) IC50 values of the polymers calculated from the dose-response curves.
Figure 4
Figure 4
Cellular uptake of polyplexes in MDA-MB-231 cells. (A) Overlayed histogram of flow cytometry analysis of cells treated with polyplexes at N:P ratio of 10 (100 nM FAM-miRNA) after a 3-h incubation. Quantification of cellular uptake shown as (B) mean fluorescence intensity (MFI) and (C) % of cells that had taken up the polyplexes. Data are shown as the mean ± SD (n = 3).
Figure 5
Figure 5
Intracellular trafficking of miRNA polyplexes in MDA-MB 231 cells by CLSM after a 3-h and 6-h incubation.
Figure 6
Figure 6
Transfection activity of polyplexes (N:P=10, anti-miRNA 100 nM). MiR-210 level was detected by TaqMan qRT-PCR in MDA-MB 231 cells. Data are shown as mean ± SD (n = 3). **P < 0.01.
Figure 7
Figure 7
Anticancer activity of polymer/miRNA polyplexes in MDA-MB 231 cells. Cells were treated for 48 h with polymer/anti-miR-NC or polymer/anti-miR-210 prepared at N:P ratio of 10 (anti-miRNA 100 nM). Cell viability was measured by Cell Titer Blue assay. Data are shown as mean ± SD (n = 3). **P < 0.01, ***P < 0.001.
Figure 8
Figure 8
Inhibition of cancer cell migration. (A) MDA-MB 231 cells were treated with polymer or equivalent HCQ (20 μM) for 24 h and then allowed to migrate through transwell upon stimulation with 10% FBS for 8 h. (B) Three 20× imaging areas were randomly selected for each insert and each group was conducted in triplicate. Data are shown as mean ± SD (n = 3). ***p < 0.001 vs. PBS.
Figure 9
Figure 9
Inhibition of autophagy. (A) MDA-MB 231 cells were treated with HCQ (20 μM), PD-H, PDC17-H for 24 h before Western blot analysis. (B) The band intensities were quantified by ImageJ.
Scheme 1
Scheme 1
Synthesis of PDC copolymers.

Similar articles

Cited by

References

    1. Bartel DP. Cell. 2004;116:281. - PubMed
    1. Lewis BP, Burge CB, Bartel DP. Cell. 2005;120:15. - PubMed
    1. Calin GA, Croce CM. Nature Rev Cancer. 2006;6:857. - PubMed
    1. Croce CM. Nature Rev Genetics. 2009;10:704. - PMC - PubMed
    1. Xie Y, Murray-Stewart T, Wang Y, Yu F, Li J, Marton LJ, Casero RA, Oupický D. J Controlled Release. 2017;246:110. - PMC - PubMed

Publication types

MeSH terms