. 2017 Aug 4;17(8):1794.
doi: 10.3390/s17081794.

A Compact Energy Harvesting System for Outdoor Wireless Sensor Nodes Based on a Low-Cost In Situ Photovoltaic Panel Characterization-Modelling Unit

Affiliations

A Compact Energy Harvesting System for Outdoor Wireless Sensor Nodes Based on a Low-Cost In Situ Photovoltaic Panel Characterization-Modelling Unit

Diego Antolín et al. Sensors (Basel). .

Abstract

This paper presents a low-cost high-efficiency solar energy harvesting system to power outdoor wireless sensor nodes. It is based on a Voltage Open Circuit (VOC) algorithm that estimates the open-circuit voltage by means of a multilayer perceptron neural network model trained using local experimental characterization data, which are acquired through a novel low cost characterization system incorporated into the deployed node. Both units-characterization and modelling-are controlled by the same low-cost microcontroller, providing a complete solution which can be understood as a virtual pilot cell, with identical characteristics to those of the specific small solar cell installed on the sensor node, that besides allows an easy adaptation to changes in the actual environmental conditions, panel aging, etc. Experimental comparison to a classical pilot panel based VOC algorithm show better efficiency under the same tested conditions.

Keywords: PV modelling; artificial neural network; cyber-physical systems; energy harvesting; maximum power point tracking; solar panel; wireless sensor network.


Conflict of interest statement

The authors declare no conflict of interest.

Figures

Figure 1
Figure 1
Typical power consumption profile for an environmental wireless sensor node.
Figure 2
Figure 2
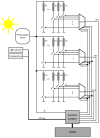
Proposed PV panel characterization system.
Figure 3
Figure 3
System software dataflow.
Figure 4
Figure 4
Characterization system connected to the solar panel (control host not shown).
Figure 5
Figure 5
Panel output voltage values (green) in the characterization process sweeping resistor values in the PV panel load. Rising and descent slope in purple signal indicates the start and end time in the measurement. Time span is below 20 ms (see cursor measures).
Figure 6
Figure 6
Real and simulated voltage-to-load curves at three different light and temperature conditions.
Figure 7
Figure 7
P-V curves obtained from the ANN-based solar panel model.
Figure 8
Figure 8
Generic solar energy harvesting block diagram.
Figure 9
Figure 9
Boost DC-DC circuit. In red, a dual solar panel MPPT control block diagram.
Figure 10
Figure 10
Proposed ANN-based VOC MPPT.
Figure 11
Figure 11
Multilayer perceptron weight values obtained to modelling the solar panel behavior. Red values correspond to bias weights.
Figure 12
Figure 12
Pseudocode representing the piecewise polynomial implementation of equation.
Figure 13
Figure 13
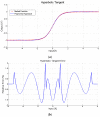
(a) Hyperbolic tangent computation using a standard C library tanh(x) function (red) and the piecewise approach (blue) on a microcontroller; (b) Relative error of the polynomial fitting compared to the library function.
Figure 14
Figure 14
Computing time measurement for three different input values using (a) C library-based tanh(x) operation and (b) polynomial approach; Times correspond, respectively, to calculate the operations for inputs that meet: abs(x) ≥ 5.3 (TA, TA); 5.3 > abs(x) > 0.9 (TB, TB); and abs(x) ≤ 0.9 (TC, TC).
Figure 14
Figure 14
Computing time measurement for three different input values using (a) C library-based tanh(x) operation and (b) polynomial approach; Times correspond, respectively, to calculate the operations for inputs that meet: abs(x) ≥ 5.3 (TA, TA); 5.3 > abs(x) > 0.9 (TB, TB); and abs(x) ≤ 0.9 (TC, TC).
Figure 15
Figure 15
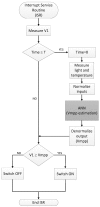
ANN-based VOC MPPT routine flow diagram.
Figure 16
Figure 16
Full solar energy harvesting system based on ANN MPPT and energy storage system (supercapacitor): solar panel (left), control system (centre, on top, includes the characterization system), DC-DC system (centre, bottom) and supercap (right). In this case, only one of the 1.5 F supercaps is connected to the boost system for characterization purposes.
Figure 17
Figure 17
Charge curves for a 1.5 F supercap for a VOC algorithm using a reference panel (blue) and the ANN-based solar panel model (yellow). Environmental conditions (irradiance and temperature, average): (a) 850 W/m2, 35 °C; (b) 1300 W/ m2, 55 °C; (c) 1120 W/ m2, 43 °C; (d) 500 W/ m2, 26 °C.

References

    1. Han G., Dong Y., Guo H., Shu L., Wu D. Cross-layer optimized routing in wireless sensor networks with duty cycle and energy harvesting. Wirel. Commun. Mob. Comput. 2015;15:1957–1981. doi: 10.1002/wcm.2468. - DOI
    1. Cammarano A., Petrioli C., Spenza D. Online Energy Harvesting Prediction in Environmentally Powered Wireless Sensor Networks. IEEE Sens. J. 2016;16:6793–6804. doi: 10.1109/JSEN.2016.2587220. - DOI
    1. Zou T., Lin S., Feng Q., Chen Y. Energy-Efficient Control with Harvesting Predictions for Solar-Powered Wireless Sensor Networks. Sensors. 2016;16:53. doi: 10.3390/s16010053. - DOI - PMC - PubMed
    1. Yoon I., Kim H., Noh D.K. Adaptive Data Aggregation and Compression to Improve Energy Utilization in Solar-Powered Wireless Sensor Networks. Sensors. 2017;17:1226. doi: 10.3390/s17061226. - DOI - PMC - PubMed
    1. Mandourarakis I., Koutroulis E. Optimal design of a boost-type DC-DC converter for PV power-supplied wireless sensor networks; Proceedings of the 2015 IEEE International Conference on Industrial Technology (ICIT); Seville, Spain. 17–19 March 2015; pp. 1100–1105.

LinkOut - more resources