. 2017 Dec;32(12):2405-2414.
doi: 10.1002/jbmr.3232. Epub 2017 Sep 6.

Bibliometric Analysis of Female Authorship Trends and Collaboration Dynamics Over JBMR's 30-Year History

Affiliations

Bibliometric Analysis of Female Authorship Trends and Collaboration Dynamics Over JBMR's 30-Year History

Austin E Wininger et al. J Bone Miner Res. 2017 Dec.

Abstract

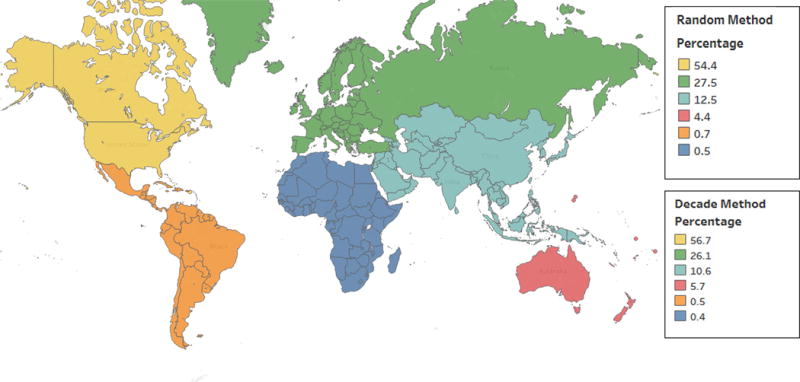
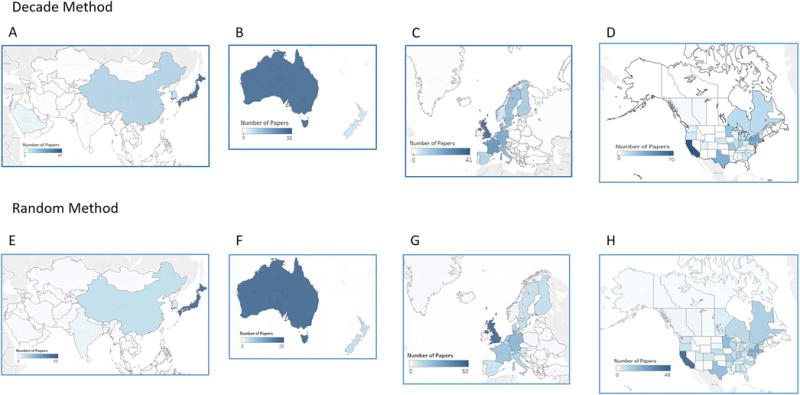
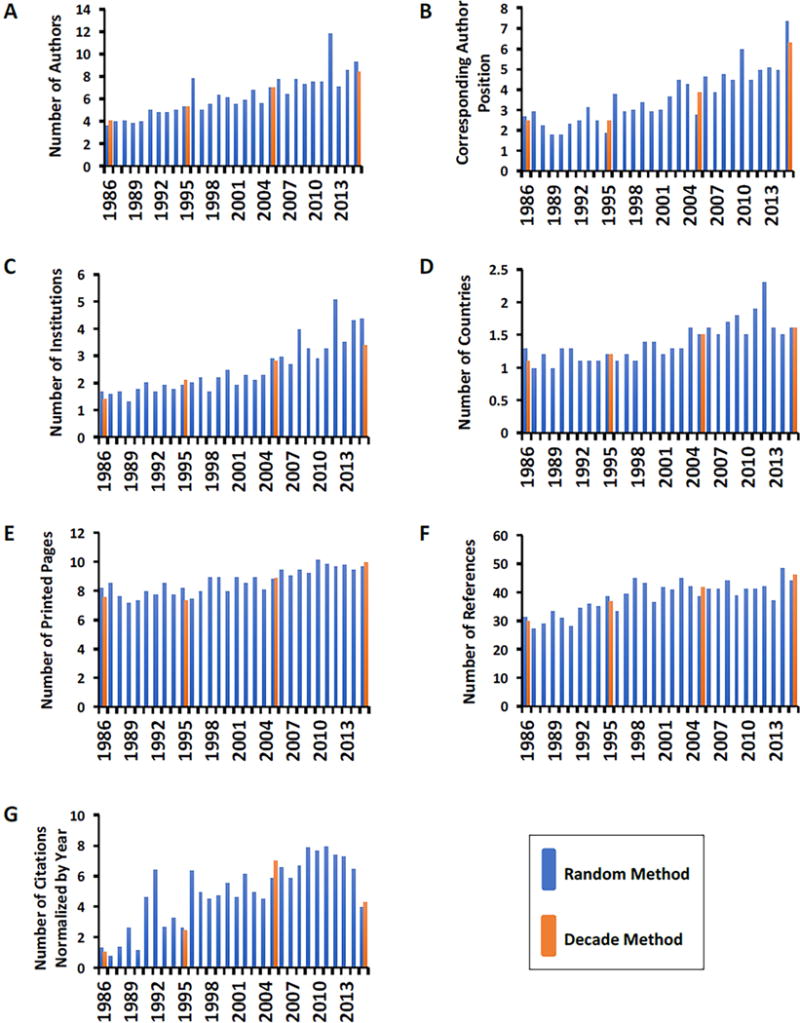
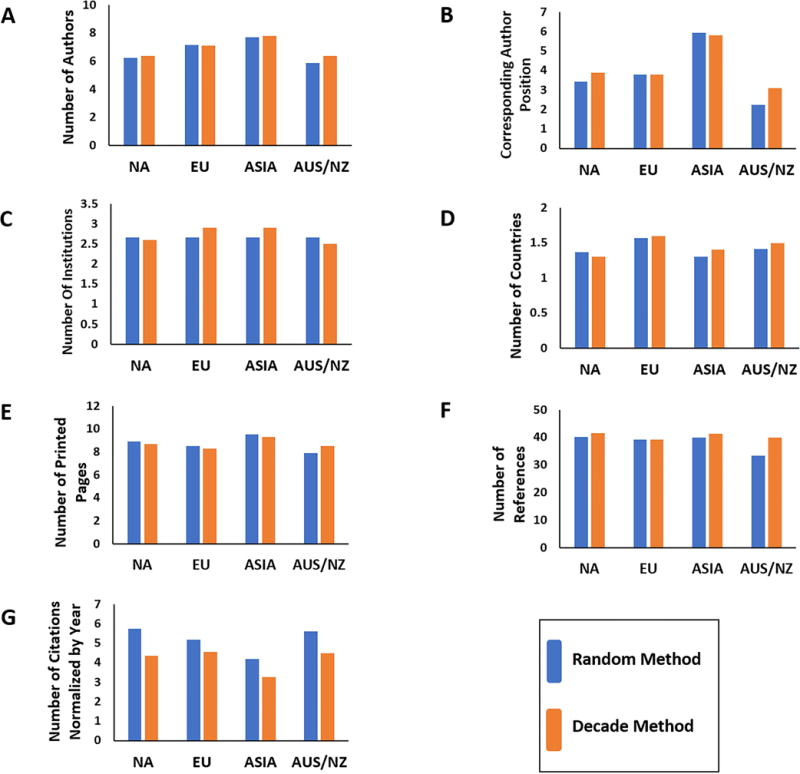
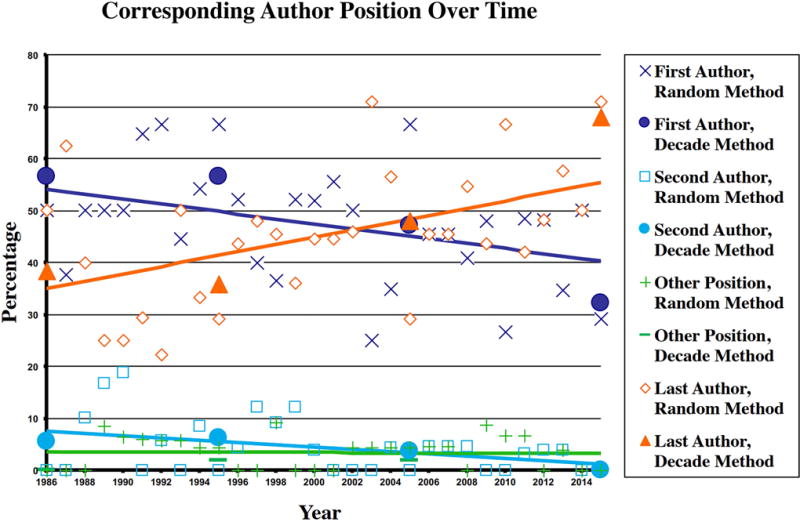
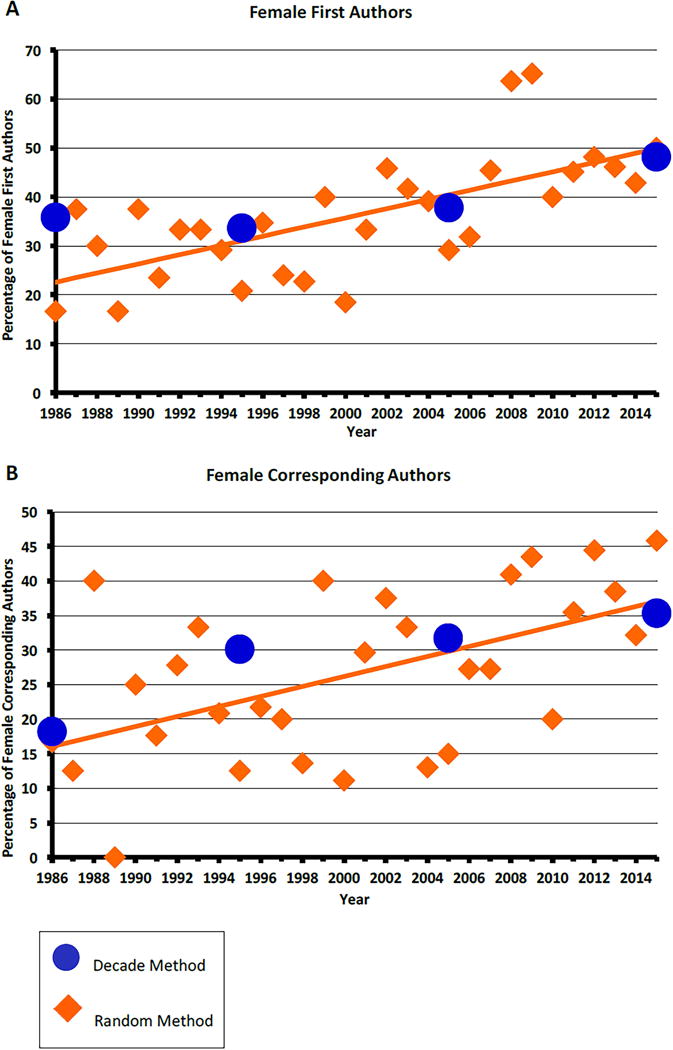
In academia, authorship is considered a currency and is important for career advancement. As the Journal of Bone and Mineral Research (JBMR) is the highest-ranked journal in the field of bone, muscle, and mineral metabolism and is the official publication of the American Society for Bone and Mineral Research, we sought to examine authorship changes over JBMR's 30-year history. Two bibliometric methods were used to collect the data. The "decade method" included all published manuscripts throughout 1 year in each decade over the past 30 years starting with the inaugural year, yielding 746 manuscripts for analysis. The "random method" examined 10% of published manuscripts from each of the 30 years, yielding 652 manuscripts for analysis. Using both methods, the average number of authors per manuscript, numerical location of the corresponding author, number of collaborating institutions, number of collaborating countries, number of printed manuscript pages, and the number of times each manuscript was cited all significantly increased between 1986 and 2015 (p < 10-4 ). Using the decade method, there was a significant increase in the percentage of female first authors over time from 35.8% in 1986 to 47.7% in 2015 (p = 0.02), and this trend was confirmed using the random method. The highest percentage of female first authors in 2015 was in Europe (60.0%), and Europe also had the most dramatic increase in female first authors over time (more than double in 2015 compared with 1986). Likewise, the overall number of female corresponding authors significantly increased during the past 30 years. With the increasing demands of publishing in academic medicine, understanding changes in publishing characteristics over time and by geographical region is important. These findings highlight JBMR's authorship trends over the past 30 years and demonstrate those countries having the most changes and where challenges still exist. © 2017 American Society for Bone and Mineral Research.

Keywords: AUTHORSHIP TRENDS; BIBLIOMETRIC; COUNTRY; GENDER; TIME.


Figures

Figure 1
Figure 1
Countries were separated into six regions for analyses: North America (yellow), Latin America (orange), Europe (green), Africa (blue), Australia/New Zealand (red), and Asia (blue-green). The overall percentage of manuscripts published from each region (all years combined) is noted for both the decade method and the random method.
Figure 2
Figure 2
Map of A) Asia; B) Australia/New Zealand; C) Europe; and D) North America, showing the countries or states/provinces contributing published manuscripts from data obtained via the decade method (upper row). Map of E) Asia; F) Australia/New Zealand; G) Europe; and H) North America, showing the countries or states/provinces contributing published manuscripts from data obtained via the random method (lower row). Dark blue shading represents highest percentage of manuscripts published in the country or state/province. White indicates no manuscripts were published in the country or state/province.
Figure 3
Figure 3
Trends over time using random (blue) and decade (orange) method. A) Number of co-authors. B) Corresponding author position. C) Number of institutions collaborating on published manuscripts. D) Number of countries from which authors on manuscripts reside. E) Length of published manuscripts. F) Number of references cited within each manuscript. G) Number of times each published manuscript was cited in other manuscripts (normalized based on number of years since publication). Data are presented as the mean. The standard deviation is provided in Supplemental Table 1.
Figure 4
Figure 4
Trends by region using random (blue) and decade (orange) method. A) Number of co-authors. B) Corresponding author position. C) Number of institutions. D) Number of countries. E) Length of published manuscripts. F) Number of references per manuscript. G) Number of times each published manuscript was cited in other manuscripts (normalized based on number of years since publication). Data are presented as the mean. The standard deviation is provided in Supplemental Table 1. North America = NA, EU = Europe, Aus/NZ = Australia/New Zealand.
Figure 5
Figure 5
Changes in corresponding author position. Dark blue represents the corresponding author as the first author; light blue represents the corresponding author as the second author; orange represents the corresponding author as the last author; and green represents any other position. The bold lines represent the best fit line from linear regression analysis using the random data. The large symbols represent the decade method values, and the smaller symbols the yearly data using the random method. For the first author position, the best fit line (dark blue line) is represented by the equation: % = 997.6 – 0.48(year), r2 = 0.14, p = 0.039. For the second author position, the best fit line (light blue line) is represented by the equation % = 441 – 0.22(year), r2 = 0.13, p = 0.046. For the last author position, the best fit line (orange line) is represented by the equation % = −1360 + 0.70(year), r2 = 0.23, p = 0.008. There was no linear change over time for the other author position as seen by the straight green line (p = 0.89).
Figure 6
Figure 6
Changes over time in the percentage of female first (A) and corresponding authors (B). The best fit random method is shown in orange (open triangles the actual data points, solid line the best fit linear regression analysis), and the decade method in gray circles for that respective year. For the random method the best fit linear regression for female first authors is represented by the equation: %female 1st authors = −1844.6 + 0.94(year), r2 = 0.45, p = 0.00005. The best fit linear regression for female corresponding authors is represented by the equation: %female corresponding authors = −1420.4 + 0.72(year), r2 = 0.28, p = 0.0025.

References

    1. The World Bank. World Development Indicators-Population, female (% of total). [The World Bank Website] 2017 Jan 3; Available from: http://data.worldbank.org/indicator/SP.POP.TOTL.FE.ZS. Accessed 4 January 2016.
    1. The Organization for Economic Co-operation and Development. Education at a Glance. OECD Publishing; 2012. Available from: http://dx.doi.org/10.1787/eag-2012-en. - DOI
    1. Shen H. Inequality quantified: Mind the gender gap. Nature. 2013;495(7439):22–4. - PubMed
    1. Cochran A, Hauschild T, Elder WB, et al. Perceived gender-based barriers to careers in academic surgery. Am J Surg. 2013;206(2):263–8. - PubMed
    1. Holliday EB, Jagsi R, Wilson LD, Choi M, Thomas CR, Fuller CD. Gender differences in publication productivity, academic position, career duration, and funding among U.S. academic radiation oncology faculty. Acad Med. 2014;89(5):767–73. - PMC - PubMed