

The integrated analysis of RNA-seq and microRNA-seq depicts miRNA-mRNA networks involved in Japanese flounder (Paralichthys olivaceus) albinism
- PMID: 28777813
- PMCID: PMC5544202
- DOI: 10.1371/journal.pone.0181761
The integrated analysis of RNA-seq and microRNA-seq depicts miRNA-mRNA networks involved in Japanese flounder (Paralichthys olivaceus) albinism
Abstract
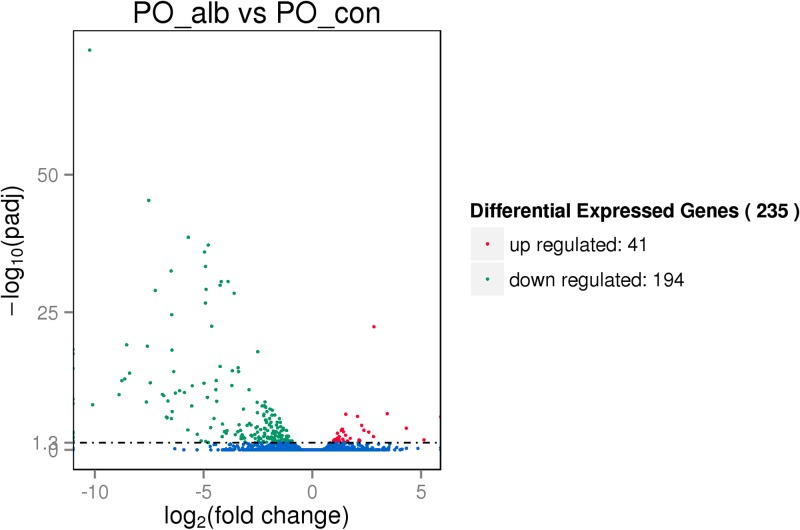
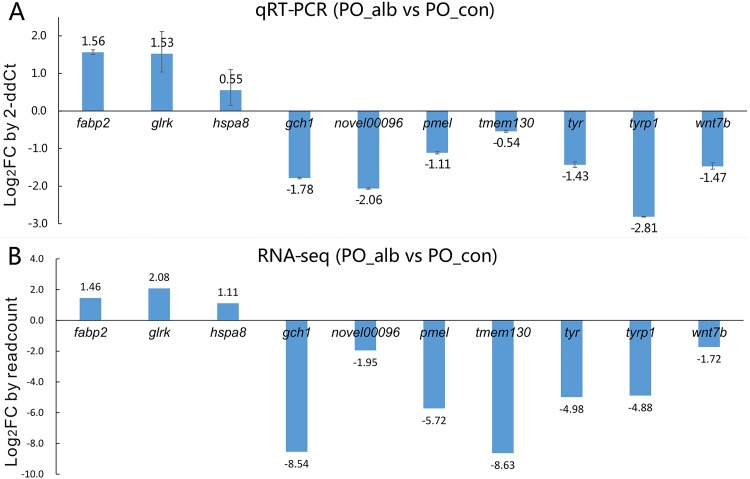
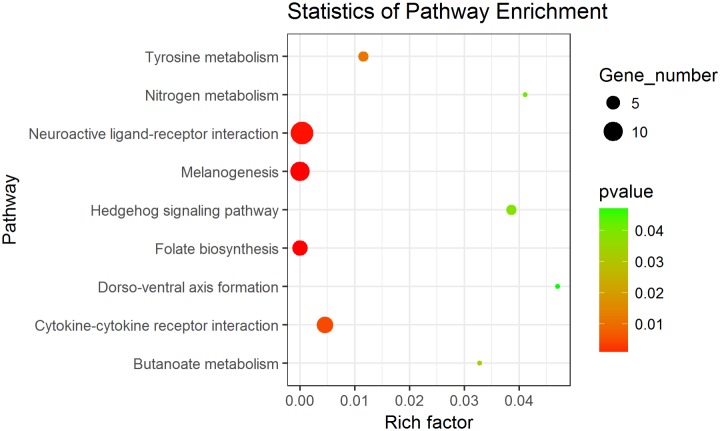
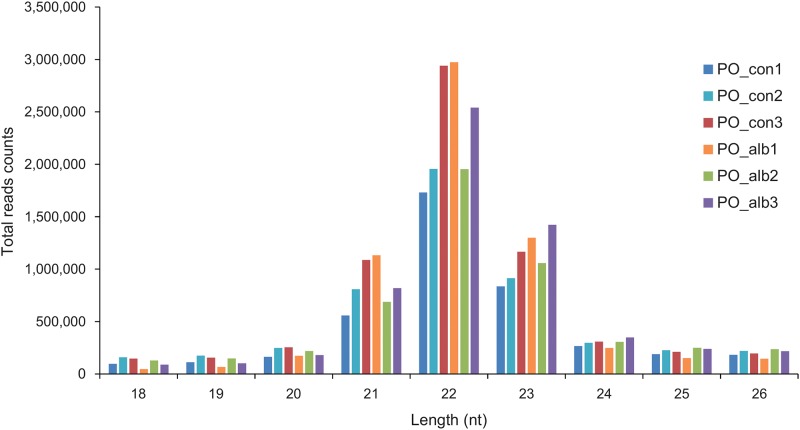
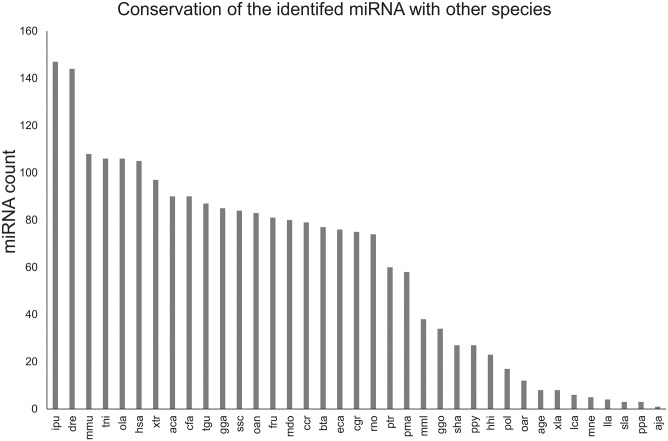
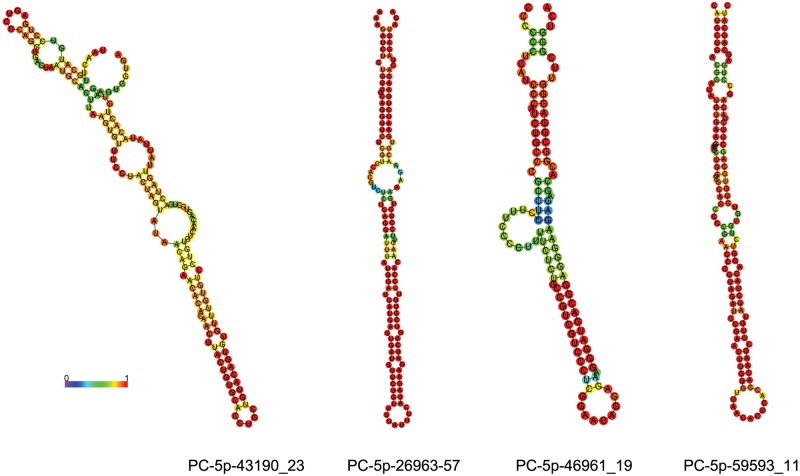
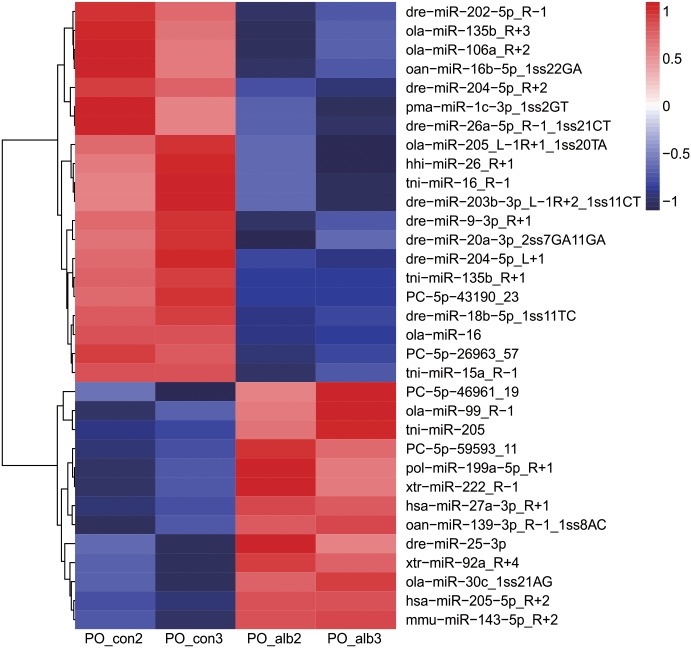
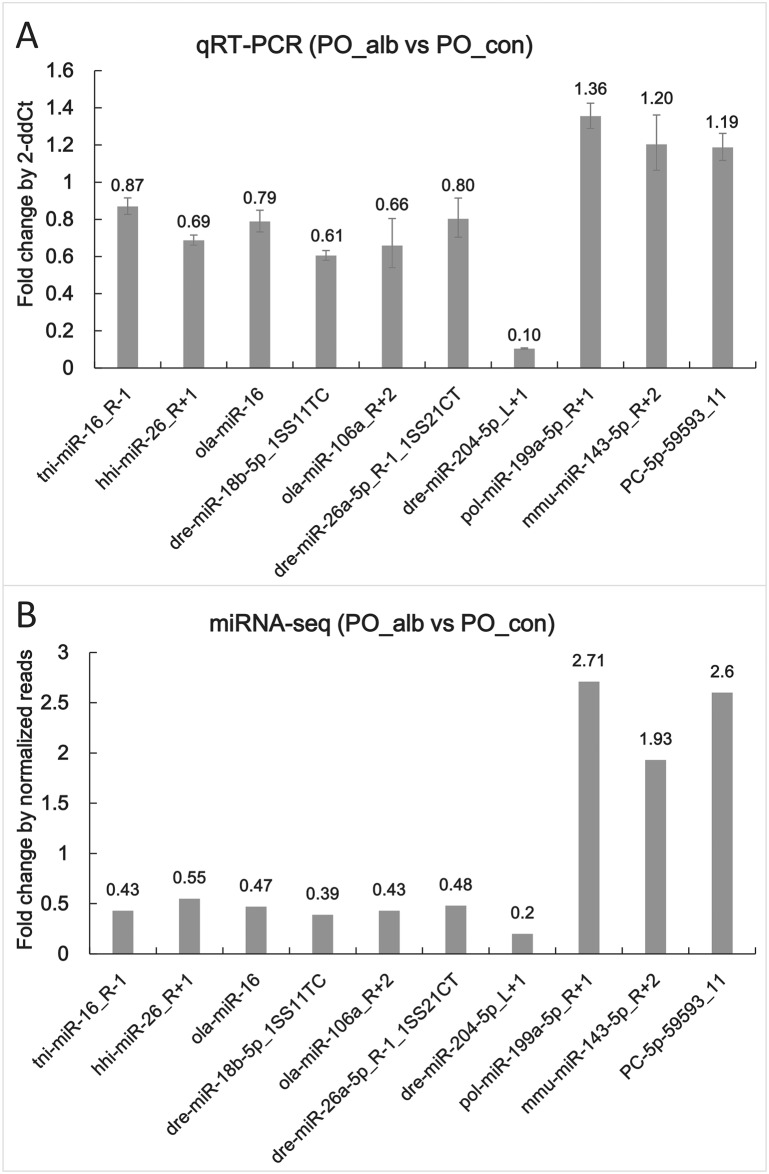
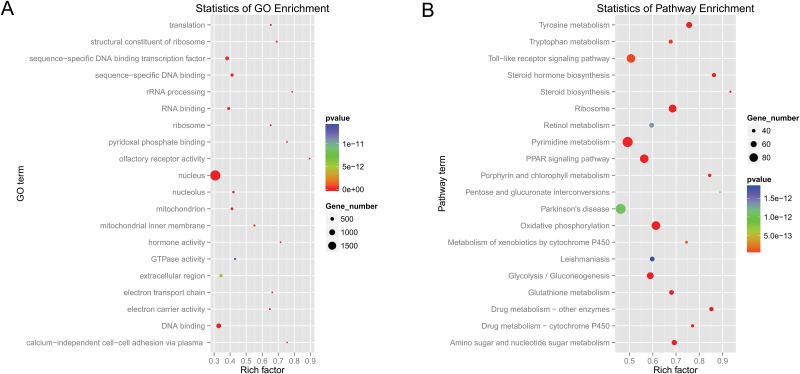
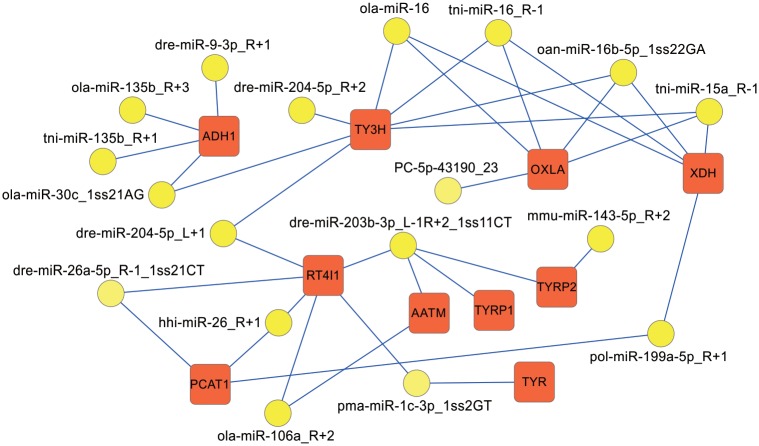
Albinism, a phenomenon characterized by pigmentation deficiency on the ocular side of Japanese flounder (Paralichthys olivaceus), has caused significant damage. Limited mRNA and microRNA (miRNA) information is available on fish pigmentation deficiency. In this study, a high-throughput sequencing strategy was employed to identify the mRNA and miRNAs involved in P. olivaceus albinism. Based on P. olivaceus genome, RNA-seq identified 21,787 know genes and 711 new genes by transcripts assembly. Of those, 235 genes exhibited significantly different expression pattern (fold change ≥2 or ≤0.5 and q-value≤0.05), including 194 down-regulated genes and 41 up-regulated genes in albino versus normally pigmented individuals. These genes were enriched to 81 GO terms and 9 KEGG pathways (p≤0.05). Among those, the pigmentation related pathways-Melanogenesis and tyrosine metabolism were contained. High-throughput miRNA sequencing identified a total of 475 miRNAs, including 64 novel miRNAs. Furthermore, 33 differentially expressed miRNAs containing 13 up-regulated and 20 down-regulated miRNAs were identified in albino versus normally pigmented individuals (fold change ≥1.5 or ≤0.67 and p≤0.05). The next target prediction discovered a variety of putative target genes, of which, 134 genes including Tyrosinase (TYR), Tyrosinase-related protein 1 (TYRP1), Microphthalmia-associated transcription factor (MITF) were overlapped with differentially expressed genes derived from RNA-seq. These target genes were significantly enriched to 254 GO terms and 103 KEGG pathways (p<0.001). Of those, tyrosine metabolism, lysosomes, phototransduction pathways, etc., attracted considerable attention due to their involvement in regulating skin pigmentation. Expression patterns of differentially expressed mRNA and miRNAs were validated in 10 mRNA and 10 miRNAs by qRT-PCR. With high-throughput mRNA and miRNA sequencing and analysis, a series of interested mRNA and miRNAs involved in fish pigmentation are identified. And the miRNA-mRNA regulatory network also provides a solid starting point for further elucidation of fish pigmentation deficiency.
Conflict of interest statement
Figures
Similar articles
-
RNA-seq and microRNA-seq analysis of Japanese flounder (Paralichthys olivaceus) larvae treated by thyroid hormones.Fish Physiol Biochem. 2019 Aug;45(4):1233-1244. doi: 10.1007/s10695-019-00654-1. Epub 2019 May 21. Fish Physiol Biochem. 2019. PMID: 31115741
-
Integrated analysis of RNA-seq and microRNA-seq depicts miRNA-mRNA networks involved in stripe patterns of Botia superciliaris skin.Funct Integr Genomics. 2019 Sep;19(5):827-838. doi: 10.1007/s10142-019-00683-2. Epub 2019 May 20. Funct Integr Genomics. 2019. PMID: 31111266
-
Micro-Transcriptome Analysis Reveals Immune-Related MicroRNA Regulatory Networks of Paralichthys olivaceus Induced by Vibrio anguillarum Infection.Int J Mol Sci. 2020 Jun 15;21(12):4252. doi: 10.3390/ijms21124252. Int J Mol Sci. 2020. PMID: 32549342 Free PMC article.
-
The use of high-throughput sequencing methods for plant microRNA research.RNA Biol. 2015;12(7):709-19. doi: 10.1080/15476286.2015.1053686. RNA Biol. 2015. PMID: 26016494 Free PMC article. Review.
-
miRNAs associated with immune response in teleost fish.Dev Comp Immunol. 2017 Oct;75:77-85. doi: 10.1016/j.dci.2017.02.023. Epub 2017 Feb 28. Dev Comp Immunol. 2017. PMID: 28254620 Review.
Cited by
-
Comparative transcriptome and miRNA analysis of skin pigmentation during embryonic development of Chinese soft-shelled turtle (Pelodiscus sinensis).BMC Genomics. 2022 Dec 5;23(1):801. doi: 10.1186/s12864-022-09029-y. BMC Genomics. 2022. PMID: 36471254 Free PMC article.
-
Comparative analysis of distinctive transcriptome profiles with biochemical evidence in bisphenol S- and benzo[a]pyrene-exposed liver tissues of the olive flounder Paralichthys olivaceus.PLoS One. 2018 May 1;13(5):e0196425. doi: 10.1371/journal.pone.0196425. eCollection 2018. PLoS One. 2018. PMID: 29715276 Free PMC article.
-
Transcriptomic analyses of differentially expressed human genes, micro RNAs and long-non-coding RNAs in severe, symptomatic and asymptomatic malaria infection.Sci Rep. 2024 Jul 23;14(1):16901. doi: 10.1038/s41598-024-67663-w. Sci Rep. 2024. PMID: 39043812 Free PMC article.
-
Integrated Analysis of Transcriptomic, miRNA and Proteomic Changes of a Novel Hybrid Yellow Catfish Uncovers Key Roles for miRNAs in Heterosis.Mol Cell Proteomics. 2019 Jul;18(7):1437-1453. doi: 10.1074/mcp.RA118.001297. Epub 2019 May 15. Mol Cell Proteomics. 2019. PMID: 31092672 Free PMC article.
-
Genome-wide identification and characterization of tissue specific long non-coding RNAs and circular RNAs in common carp (Cyprinus carpio L.).Front Genet. 2023 Nov 28;14:1239434. doi: 10.3389/fgene.2023.1239434. eCollection 2023. Front Genet. 2023. PMID: 38090151 Free PMC article.
References
-
- Farabee WC. Notes on negro albinism. Science. 1903; 17(419): 75 doi: 10.1126/science.17.419.75 - DOI - PubMed
-
- Oetting WS, King RA. Molecular basis of albinism: mutations and polymorphisms of pigmentation genes associated with albinism. Hum Mutat. 1999; 13(2): 99–115. doi: 10.1002/(SICI)1098-1004(1999)13:2<99::AID-HUMU2>3.0.CO;2-C - DOI - PubMed
-
- Yamaguchi Y, Brenner M, Hearing VJ. The regulation of skin pigmentation. J Biol Chem. 2007; 282(38): 27557–27561. doi: 10.1074/jbc.R700026200 - DOI - PubMed
-
- Baxter LL, Loftus SK, Pavan WJ. Networks and pathways in pigmentation, health and disease. Wiley Interdiscip Rev Syst Biol Med. 2009; 1(3): 359–371. doi: 10.1002/wsbm.20 - DOI - PMC - PubMed
-
- Bennett DC, Lamoreux ML. The color loci of mice—a genetic century. Pigment Cell Res. 2003; 16(4): 333–344. doi: 10.1034/j.1600-0749.2003.00067.x - DOI - PubMed
MeSH terms
Substances
LinkOut - more resources
Full Text Sources
Other Literature Sources
Molecular Biology Databases
Research Materials
