. 2017 Aug 3;101(2):291-299.
doi: 10.1016/j.ajhg.2017.07.006.

Mutations in TRAPPC12 Manifest in Progressive Childhood Encephalopathy and Golgi Dysfunction

Affiliations

Mutations in TRAPPC12 Manifest in Progressive Childhood Encephalopathy and Golgi Dysfunction

Miroslav P Milev et al. Am J Hum Genet. .

Abstract

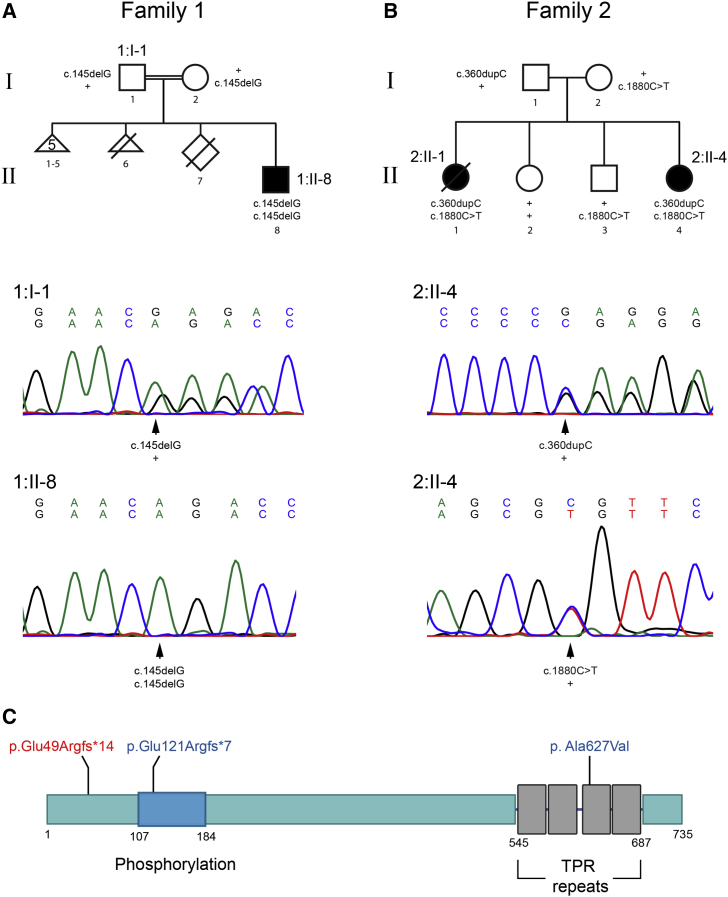
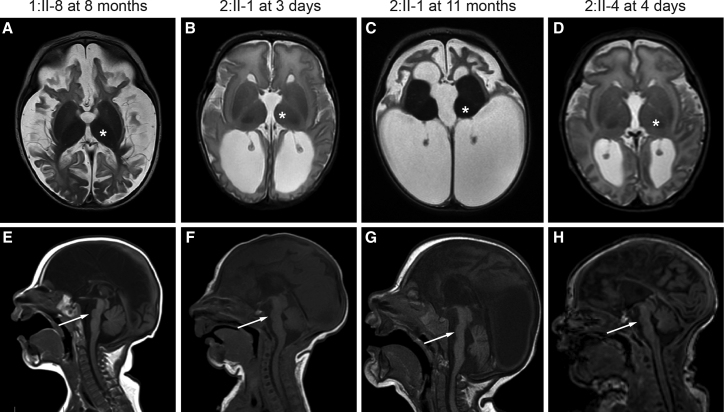
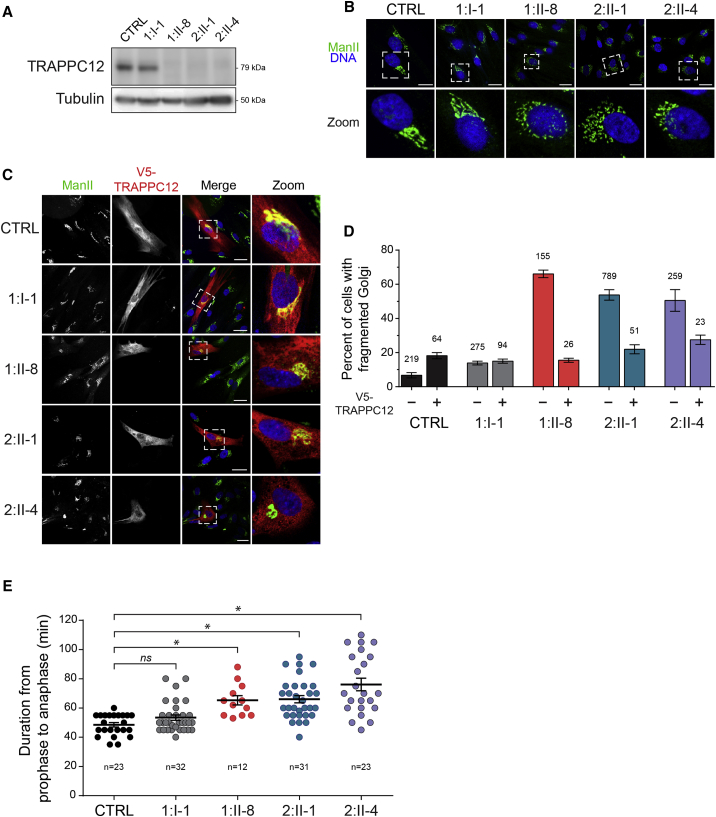
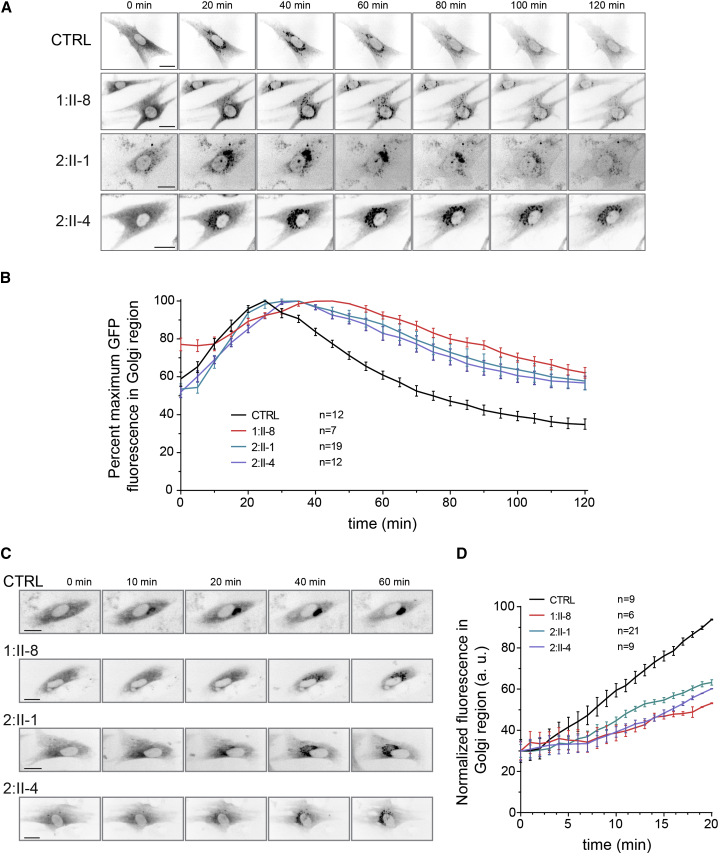
Progressive childhood encephalopathy is an etiologically heterogeneous condition characterized by progressive central nervous system dysfunction in association with a broad range of morbidity and mortality. The causes of encephalopathy can be either non-genetic or genetic. Identifying the genetic causes and dissecting the underlying mechanisms are critical to understanding brain development and improving treatments. Here, we report that variants in TRAPPC12 result in progressive childhood encephalopathy. Three individuals from two unrelated families have either a homozygous deleterious variant (c.145delG [p.Glu49Argfs14]) or compound-heterozygous variants (c.360dupC [p.Glu121Argfs7] and c.1880C>T [p. Ala627Val]). The clinical phenotypes of the three individuals are strikingly similar: severe disability, microcephaly, hearing loss, spasticity, and characteristic brain imaging findings. Fibroblasts derived from all three individuals showed a fragmented Golgi that could be rescued by expression of wild-type TRAPPC12. Protein transport from the endoplasmic reticulum to and through the Golgi was delayed. TRAPPC12 is a member of the TRAPP protein complex, which functions in membrane trafficking. Variants in several other genes encoding members of the TRAPP complex have been associated with overlapping clinical presentations, indicating shared and distinct functions for each complex member. Detailed understanding of the TRAPP-opathies will illuminate the role of membrane protein transport in human disease.

Keywords: Golgi; TRAPP; TRAPPC12; brain atrophy; encephalopathy; potocerebellar hypoplasia.


Figures

Figure 1
Figure 1
Pedigrees and Characterization of TRAPPC12 Variants (A and B) Pedigree structure for family 1 (A) and family 2 (B). Electropherograms are shown for affected regions in 1:I-1 (carrier father), 1:II-8 (affected), and 2:II-4 (affected). Note that the heterozygous variant c.145delG in the proband’s father (1:I-1) results in a mixture of bases from that region onward but not in 1:II-8. Similarly, 2:II-1 and 2:II-4 have the frameshift variant c.360dupC, resulting in a mixture of nucleotides from the point of insertion, as well as the missense c.1880C>T. (C) A cartoon of the structure of TRAPPC12 with known domains and the locations of the variants in 1:II-8 (red) and 2:II-1 and 2:II-4 (blue). Note that phosphorylation indicates a region of phosphorylation known to affect mitosis.
Figure 2
Figure 2
Brain Imaging Features of Individuals with TRAPPC12-Related Encephalopathy and Brain Atrophy (A–D) T2-weighted axial images show that all three affected individuals have severely atrophic-appearing cortex (white and gray matter). Documented volume loss was noted between 3 days (B) and 11 months (C) of age in 2:II-1. T2 signal is increased in the white matter, consistent with decreased myelination. Basal ganglia volume is relatively spared (asterisks). 2:II-4 also has progressive ventriculomegaly beyond what would be expected for cortical volume loss but did not have overt symptoms of increased intracranial pressure. (E–H) T1-weighted sagittal images show severe pons hypoplasia (arrows) and agenesis of the corpus callosum, as well as relative sparing of the cerebellum.
Figure 3
Figure 3
The Absence of TRAPPC12 from Fibroblasts Results in Changes to Golgi Morphology and Delays in Mitosis (A) Lysates from fibroblasts derived from a control sample (CTRL), the heterozygous father (1:I-1), 1:II-8, and the compound-heterozygous individuals 2:II-1 and 2:II-4 were probed for TRAPPC12 by western analysis. A tubulin loading control is also shown. (B) Control, 1:I-1, 1:II-8, 2:II-1, and 2:II-4 fibroblasts were processed for immunofluorescence microscopy and stained for the Golgi marker mannosidase II (Man II) and Hoechst (Invitrogen) to reveal the nucleus. Note the more fragmented Golgi in fibroblasts from affected individuals. Fragmentation is quantified in (D). Scale bars, 25 μm. (C) Control, 1:I-1, 1:II-8, 2:II-1, and 2:II-4 fibroblasts were transfected by electroporation with a V5-tagged wild-type TRAPPC12 construct. Cells were then processed for immunofluorescence microscopy and stained as in (B), except that anti-V5 antibody was also used to reveal the TRAPPC12-transfected cells. Note the more compact Golgi in the transfected cells than in the neighboring non-transfected cell. Scale bars, 25 μm. (D) Golgi fragmentation in non-transfected cells from (B) and (C) and V5-TRAPPC12-transfected cells from (C) were quantified (±SEM). Golgi fragmentation was based upon the criteria stated previously. The numbers above each bar represent N values. (E) Fibroblasts were grown in the presence of 75 nM SiR-tubulin (Cytoskeleton, Inc.) for 3 hr and 50 ng/mL Hoechst (to label DNA) for the final 15 min before visualization by real-time microscopy overnight. Cells that underwent mitosis during imaging were quantified (±SEM) by assessment of the time between prophase and anaphase. Prophase was defined by the appearance of condensed DNA with two centrioles at opposite poles, and anaphase was defined as the initial separation of the aligned metaphase DNA. Significance was assessed between wild-type and each subject by a one way ANOVA. Post hoc differences were made with Fisher’s probability of least squared differences. p values ≤ 0.01 are indicated by an asterisk. The antibodies used in this figure were (A) anti-TRAPPC12 (generated in house to full-length recombinant protein) and anti-tubulin (Sigma, DM1A), (B and C) anti-mannosidase II (kind gift from Dr. Kelly Moremen, University of Georgia), and (C) anti-V5 (Abcam, ab27671).
Figure 4
Figure 4
Trafficking into and out of the Golgi Is Delayed in Subjects with TRAPPC12 Variants (A) Control, 1:II-8, 2:II-1, and 2:II-4 fibroblasts were infected with an adenovirus that expresses VSVG-GFP ts045 marker protein (kind gift from Dr. Martin Lowe, University of Manchester) and maintained overnight at 40°C for trapping the marker protein in the ER. The culture was then shifted to 32°C to release the marker protein from the ER. Cells were imaged over a 2 hr period. Still images from the live-cell imaging at the times indicated are presented. Scale bars, 25 μm. (B) The fluorescence intensity in the Golgi region from individual cells in (A) was measured every 5 min and plotted (±SEM) as the mean percentage of maximal intensity. (C) Fibroblasts from a control sample, 1:II-8, 2:II-1, and 2:II-4 were transfected with a plasmid that expresses both sialyl transferase (ST)-GFP fused to a streptavidin binding protein and an ER-resident protein fused to streptavidin. The addition of 50 μM biotin resulted in the release of ST-GFP from the ER, and its appearance in the Golgi was followed in real time over a 1 hr period. Scale bars, 25 μm. (D) The fluorescence intensity in the Golgi region from individual cells in (C) was calculated every 60 s and plotted (±SEM) as the mean percentage of maximal intensity.

Similar articles

Cited by

References

    1. Stromme P., Kanavin O.J., Abdelnoor M., Woldseth B., Rootwelt T., Diderichsen J., Bjurulf B., Sommer F., Magnus P. Incidence rates of progressive childhood encephalopathy in Oslo, Norway: a population based study. BMC Pediatr. 2007;7:25–32. - PMC - PubMed
    1. Armstrong L., Biancheri R., Shyr C., Rossi A., Sinclair G., Ross C.J., Tarailo-Graovac M., Wasserman W.W., van Karnebeek C.D. AIMP1 deficiency presents as a cortical neurodegenerative disease with infantile onset. Neurogenetics. 2014;15:157–159. - PubMed
    1. Chong J.X., Caputo V., Phelps I.G., Stella L., Worgan L., Dempsey J.C., Nguyen A., Leuzzi V., Webster R., Pizzuti A., University of Washington Center for Mendelian Genomics Recessive Inactivating Mutations in TBCK, Encoding a Rab GTPase-Activating Protein, Cause Severe Infantile Syndromic Encephalopathy. Am. J. Hum. Genet. 2016;98:772–781. - PMC - PubMed
    1. Dimassi S., Labalme A., Ville D., Calender A., Mignot C., Boutry-Kryza N., de Bellescize J., Rivier-Ringenbach C., Bourel-Ponchel E., Cheillan D. Whole-exome sequencing improves the diagnosis yield in sporadic infantile spasm syndrome. Clin. Genet. 2016;89:198–204. - PubMed
    1. Kurata H., Terashima H., Nakashima M., Okazaki T., Matsumura W., Ohno K., Saito Y., Maegaki Y., Kubota M., Nanba E. Characterization of SPATA5-related encephalopathy in early childhood. Clin. Genet. 2016;90:437–444. - PubMed

MeSH terms

Substances