

Induction of Shiga Toxin-Encoding Prophage by Abiotic Environmental Stress in Food
- PMID: 28778890
- PMCID: PMC5601330
- DOI: 10.1128/AEM.01378-17
Induction of Shiga Toxin-Encoding Prophage by Abiotic Environmental Stress in Food
Abstract
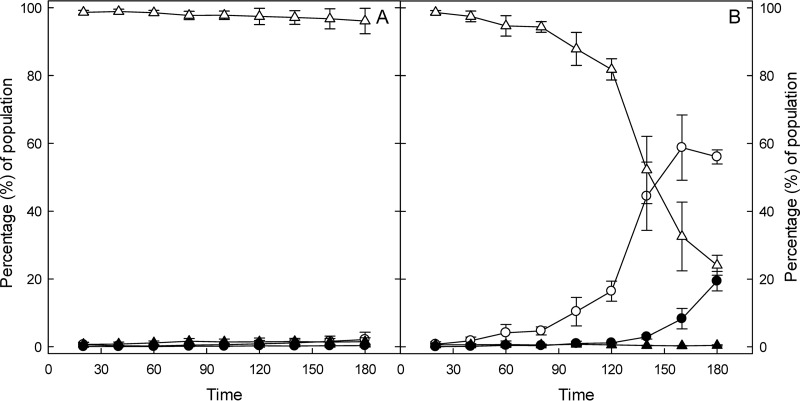
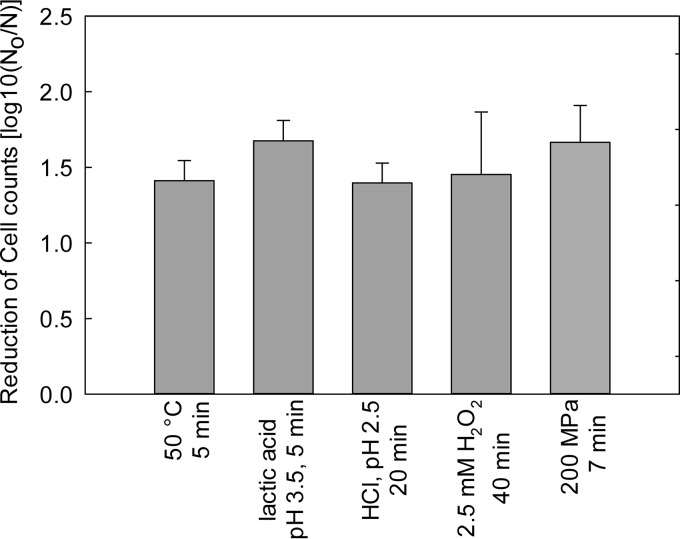
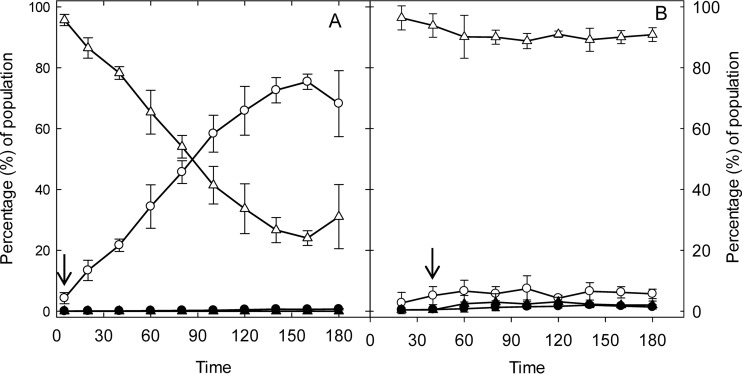
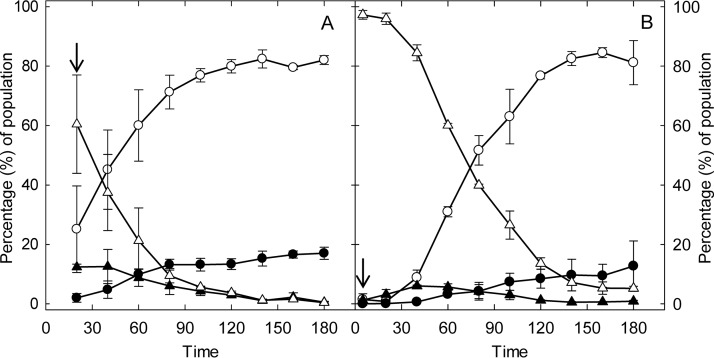
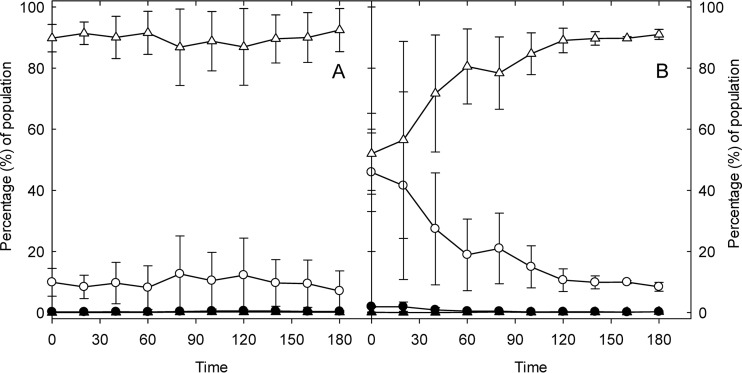
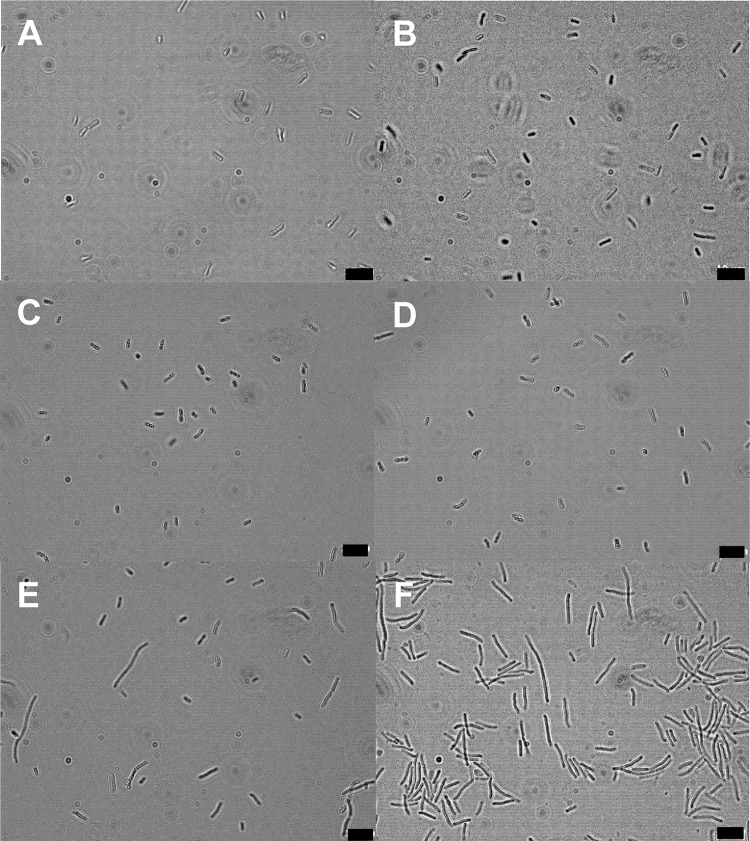
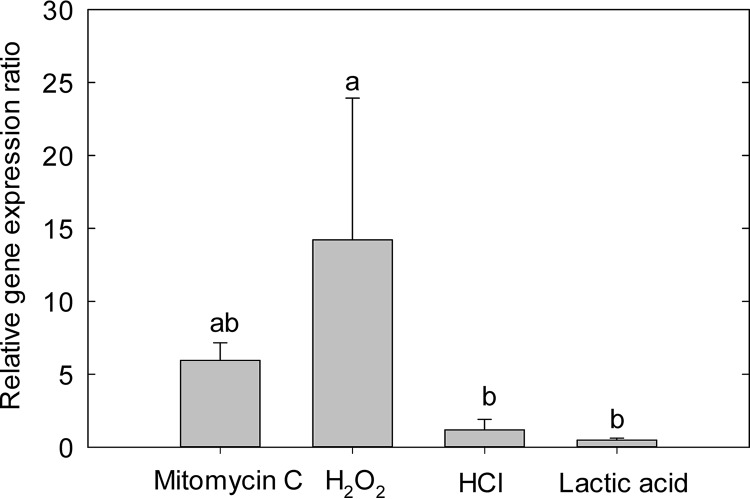
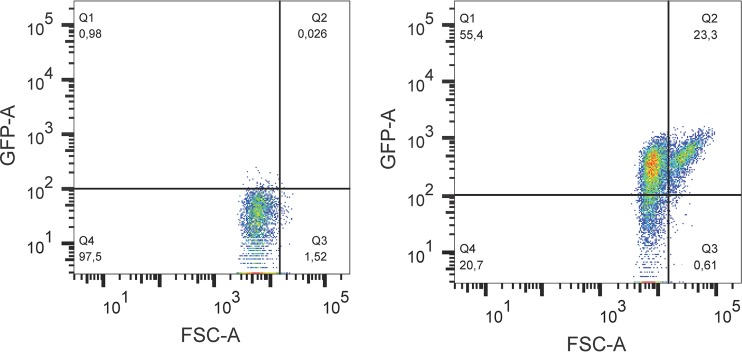
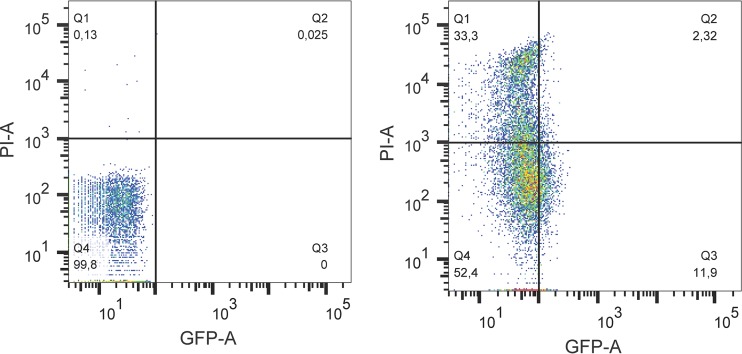
The prophage-encoded Shiga toxin is a major virulence factor in Stx-producing Escherichia coli (STEC). Toxin production and phage production are linked and occur after induction of the RecA-dependent SOS response. However, food-related stress and Stx-prophage induction have not been studied at the single-cell level. This study investigated the effects of abiotic environmental stress on stx expression by single-cell quantification of gene expression in STEC O104:H4 Δstx2::gfp::ampr In addition, the effect of stress on production of phage particles was determined. The lethality of stressors, including heat, HCl, lactic acid, hydrogen peroxide, and high hydrostatic pressure, was selected to reduce cell counts by 1 to 2 log CFU/ml. The integrity of the bacterial membrane after exposure to stress was measured by propidium iodide (PI). The fluorescent signals of green fluorescent protein (GFP) and PI were quantified by flow cytometry. The mechanism of prophage induction by stress was evaluated by relative gene expression of recA and cell morphology. Acid (pH < 3.5) and H2O2 (2.5 mM) induced the expression of stx2 in about 18% and 3% of the population, respectively. The mechanism of prophage induction by acid differs from that of induction by H2O2 H2O2 induction but not acid induction corresponded to production of infectious phage particles, upregulation of recA, and cell filamentation. Pressure (200 MPa) or heat did not induce the Stx2-encoding prophage (Stx2-prophage). Overall, the quantification method developed in this study allowed investigation of prophage induction and physiological properties at the single-cell level. H2O2 and acids mediate different pathways to induce Stx2-prophage.IMPORTANCE Induction of the Stx-prophage in STEC results in production of phage particles and Stx and thus relates to virulence as well as the transduction of virulence genes. This study developed a method for a detection of the induction of Stx-prophages at the single-cell level; membrane permeability and an indication of SOS response to environmental stress were additionally assessed. H2O2 and mitomycin C induced expression of the prophage and activated a SOS response. In contrast, HCl and lactic acid induced the Stx-prophage but not the SOS response. The lifestyle of STEC exposes the organism to intestinal and extraintestinal environments that impose oxidative and acid stress. A more thorough understanding of the influence of food processing-related stressors on Stx-prophage expression thus facilitates control of STEC in food systems by minimizing prophage induction during food production and storage.
Keywords: E. coli O104:H4; RecA-independent SOS response; STEC; Shiga toxin; Shiga toxin-producing E. coli; environmental stress; membrane permeability; prophage induction; single-cell detection.
Copyright © 2017 American Society for Microbiology.
Figures
Similar articles
-
Differential induction of Shiga toxin in environmental Escherichia coli O145:H28 strains carrying the same genotype as the outbreak strains.Int J Food Microbiol. 2021 Feb 2;339:109029. doi: 10.1016/j.ijfoodmicro.2020.109029. Epub 2020 Dec 23. Int J Food Microbiol. 2021. PMID: 33360585
-
Effect of drying on oxidation of membrane lipids and expression of genes encoded by the Shiga toxin prophage in Escherichia coli.Food Microbiol. 2020 Apr;86:103332. doi: 10.1016/j.fm.2019.103332. Epub 2019 Sep 16. Food Microbiol. 2020. PMID: 31703888
-
Cinnamon Oil Inhibits Shiga Toxin Type 2 Phage Induction and Shiga Toxin Type 2 Production in Escherichia coli O157:H7.Appl Environ Microbiol. 2016 Oct 27;82(22):6531-6540. doi: 10.1128/AEM.01702-16. Print 2016 Nov 15. Appl Environ Microbiol. 2016. PMID: 27590808 Free PMC article.
-
Altruism of Shiga toxin-producing Escherichia coli: recent hypothesis versus experimental results.Front Cell Infect Microbiol. 2013 Jan 4;2:166. doi: 10.3389/fcimb.2012.00166. eCollection 2012. Front Cell Infect Microbiol. 2013. PMID: 23316482 Free PMC article. Review.
-
Characteristics of the Shiga-toxin-producing enteroaggregative Escherichia coli O104:H4 German outbreak strain and of STEC strains isolated in Spain.Int Microbiol. 2011 Sep;14(3):121-41. doi: 10.2436/20.1501.01.142. Int Microbiol. 2011. PMID: 22101411 Review.
Cited by
-
Investigation of the Causes of Shigatoxigenic Escherichia coli PCR Positive and Culture Negative Samples.Microorganisms. 2020 Apr 18;8(4):587. doi: 10.3390/microorganisms8040587. Microorganisms. 2020. PMID: 32325659 Free PMC article.
-
Membrane Vesicle Production as a Bacterial Defense Against Stress.Front Microbiol. 2020 Dec 9;11:600221. doi: 10.3389/fmicb.2020.600221. eCollection 2020. Front Microbiol. 2020. PMID: 33362747 Free PMC article. Review.
-
Contribution of the Locus of Heat Resistance to Growth and Survival of Escherichia coli at Alkaline pH and at Alkaline pH in the Presence of Chlorine.Microorganisms. 2021 Mar 28;9(4):701. doi: 10.3390/microorganisms9040701. Microorganisms. 2021. PMID: 33800639 Free PMC article.
-
Impact of Shiga-toxin encoding gene transduction from O80:H2 Shiga toxigenic Escherichia coli (STEC) on non-STEC strains.Sci Rep. 2022 Dec 14;12(1):21587. doi: 10.1038/s41598-022-26198-8. Sci Rep. 2022. PMID: 36517572 Free PMC article.
-
Prophage Diversity Across Salmonella and Verotoxin-Producing Escherichia coli in Agricultural Niches of British Columbia, Canada.Front Microbiol. 2022 Jul 22;13:853703. doi: 10.3389/fmicb.2022.853703. eCollection 2022. Front Microbiol. 2022. PMID: 35935192 Free PMC article.
References
Publication types
MeSH terms
Substances
LinkOut - more resources
Full Text Sources
Other Literature Sources
Research Materials
Miscellaneous
