

Salt Marsh Bacterial Communities before and after the Deepwater Horizon Oil Spill
- PMID: 28778895
- PMCID: PMC5626990
- DOI: 10.1128/AEM.00784-17
Salt Marsh Bacterial Communities before and after the Deepwater Horizon Oil Spill
Abstract
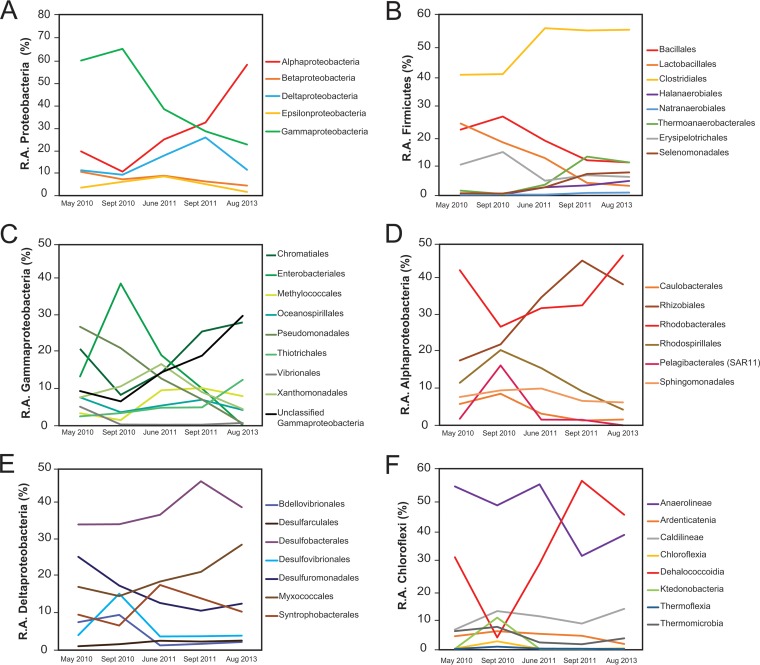
Coastal salt marshes along the northern Gulf of Mexico shoreline received varied types and amounts of weathered oil residues after the 2010 Deepwater Horizon oil spill. At the time, predicting how marsh bacterial communities would respond and/or recover to oiling and other environmental stressors was difficult because baseline information on community composition and dynamics was generally unavailable. Here, we evaluated marsh vegetation, physicochemistry, flooding frequency, hydrocarbon chemistry, and subtidal sediment bacterial communities from 16S rRNA gene surveys at 11 sites in southern Louisiana before the oil spill and resampled the same marshes three to four times over 38 months after the spill. Calculated hydrocarbon biomarker indices indicated that oil replaced native natural organic matter (NOM) originating from Spartina alterniflora and marine phytoplankton in the marshes between May 2010 and September 2010. At all the studied marshes, the major class- and order-level shifts among the phyla Proteobacteria, Firmicutes, Bacteroidetes, and Actinobacteria occurred within these first 4 months, but another community shift occurred at the time of peak oiling in 2011. Two years later, hydrocarbon levels decreased and bacterial communities became more diverse, being dominated by Alphaproteobacteria (Rhizobiales), Chloroflexi (Dehalococcoidia), and Planctomycetes Compositional changes through time could be explained by NOM source differences, perhaps due to vegetation changes, as well as marsh flooding and salinity excursions linked to freshwater diversions. These findings indicate that persistent hydrocarbon exposure alone did not explain long-term community shifts.IMPORTANCE Significant deterioration of coastal salt marshes in Louisiana has been linked to natural and anthropogenic stressors that can adversely affect how ecosystems function. Although microorganisms carry out and regulate most biogeochemical reactions, the diversity of bacterial communities in coastal marshes is poorly known, with limited investigation of potential changes in bacterial communities in response to various environmental stressors. The Deepwater Horizon oil spill provided an unprecedented opportunity to study the long-term effects of an oil spill on microbial systems in marshes. Compared to previous studies, the significance of our research stems from (i) a broader geographic range of studied marshes, (ii) an extended time frame of data collection that includes prespill conditions, (iii) a more accurate procedure using biomarker indices to understand oiling, and (iv) an examination of other potential stressors linked to in situ environmental changes, aside from oil exposure.
Keywords: Deepwater Horizon; Gulf of Mexico; PAHs; bacterial diversity; n-alkanes; organic matter; sediment.
Copyright © 2017 American Society for Microbiology.
Figures


Similar articles
-
Salt marsh denitrification is impacted by oiling intensity six years after the Deepwater Horizon oil spill.Environ Pollut. 2018 Dec;243(Pt B):1606-1614. doi: 10.1016/j.envpol.2018.09.034. Epub 2018 Sep 18. Environ Pollut. 2018. PMID: 30296756
-
Response of salt marshes to oiling from the Deepwater Horizon spill: Implications for plant growth, soil surface-erosion, and shoreline stability.Sci Total Environ. 2016 Jul 1;557-558:369-77. doi: 10.1016/j.scitotenv.2016.03.049. Epub 2016 Mar 24. Sci Total Environ. 2016. PMID: 27016685
-
Composition and depth distribution of hydrocarbons in Barataria Bay marsh sediments after the Deepwater Horizon oil spill.Environ Pollut. 2016 Jul;214:101-113. doi: 10.1016/j.envpol.2016.03.071. Epub 2016 Apr 9. Environ Pollut. 2016. PMID: 27064616
-
Environmental effects of the Deepwater Horizon oil spill: A review.Mar Pollut Bull. 2016 Sep 15;110(1):28-51. doi: 10.1016/j.marpolbul.2016.06.027. Epub 2016 Jun 11. Mar Pollut Bull. 2016. PMID: 27301686 Review.
-
Microbial responses to the Deepwater Horizon oil spill: from coastal wetlands to the deep sea.Ann Rev Mar Sci. 2015;7:377-401. doi: 10.1146/annurev-marine-010814-015543. Epub 2014 Sep 17. Ann Rev Mar Sci. 2015. PMID: 25251273 Review.
Cited by
-
Mercury concentrations in Seaside Sparrows and Marsh Rice Rats differ across the Mississippi River Estuary.Ecotoxicology. 2024 Oct;33(8):959-971. doi: 10.1007/s10646-024-02789-1. Epub 2024 Jul 24. Ecotoxicology. 2024. PMID: 39048895 Free PMC article.
-
A Retrospective Review of Microbiological Methods Applied in Studies Following the Deepwater Horizon Oil Spill.Front Microbiol. 2018 Mar 23;9:520. doi: 10.3389/fmicb.2018.00520. eCollection 2018. Front Microbiol. 2018. PMID: 29628913 Free PMC article. Review.
-
Diversity and potential plant growth promoting capacity of seed endophytic bacteria of the holoparasite Cistanche phelypaea (Orobanchaceae).Sci Rep. 2023 Jul 22;13(1):11835. doi: 10.1038/s41598-023-38899-9. Sci Rep. 2023. PMID: 37481658 Free PMC article.
-
Polyphasic Analysis Reveals Potential Petroleum Hydrocarbon Degradation and Biosurfactant Production by Rare Biosphere Thermophilic Bacteria From Deception Island, an Active Antarctic Volcano.Front Microbiol. 2022 May 4;13:885557. doi: 10.3389/fmicb.2022.885557. eCollection 2022. Front Microbiol. 2022. PMID: 35602031 Free PMC article.
-
Natural and anthropogenic carbon input affect microbial activity in salt marsh sediment.Front Microbiol. 2023 Sep 7;14:1235906. doi: 10.3389/fmicb.2023.1235906. eCollection 2023. Front Microbiol. 2023. PMID: 37744927 Free PMC article.
References
-
- Barrett GW, Van Dyne GM, Odum EP. 1976. Stress ecology. Bioscience 26:192–194. doi: 10.2307/1297248. - DOI
-
- Odum EP. 1985. Trends expected in stressed ecosystems. Bioscience 35:419–422. doi: 10.2307/1310021. - DOI
-
- Gagliano SM, Meyer-Arendt KJ, Wicker KM. 1981. Land loss in the Mississippi River deltaic plain. Trans Gulf Coast Assoc Geol Soc 31:295–300.
-
- Morton RA. 2008. Historical changes in the Mississippi-Alabama barrier-island chain and the roles of extreme storms, sea level, and human activities. J Coast Res 24:1587–1600. doi: 10.2112/07-0953.1. - DOI
Publication types
MeSH terms
LinkOut - more resources
Full Text Sources
Other Literature Sources
Medical
