

The relationship between lymphangion chain length and maximum pressure generation established through in vivo imaging and computational modeling
- PMID: 28778909
- PMCID: PMC5814651
- DOI: 10.1152/ajpheart.00003.2017
The relationship between lymphangion chain length and maximum pressure generation established through in vivo imaging and computational modeling
Abstract
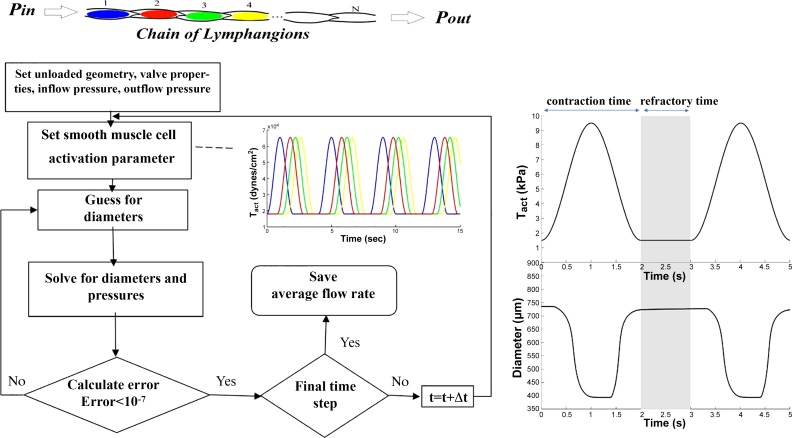
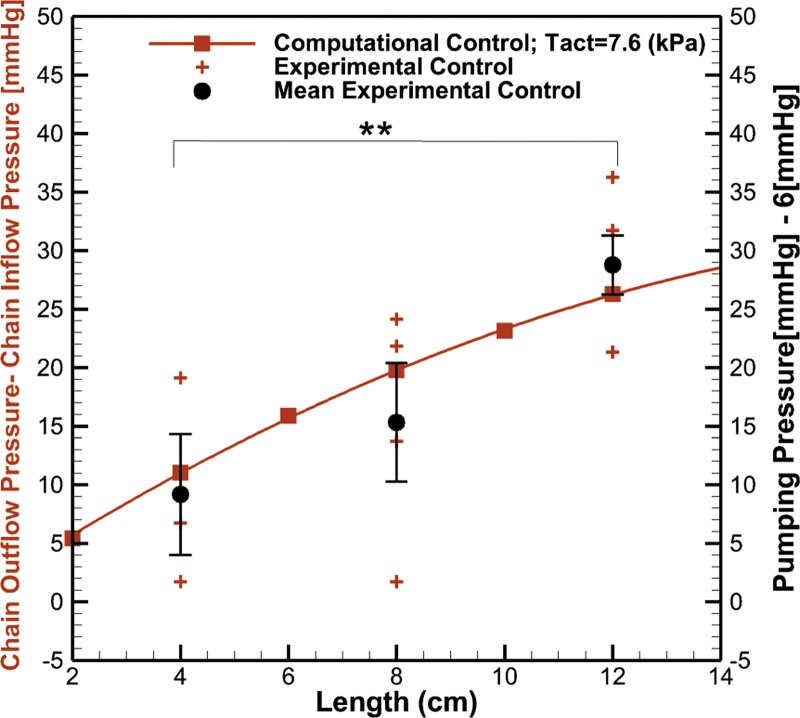
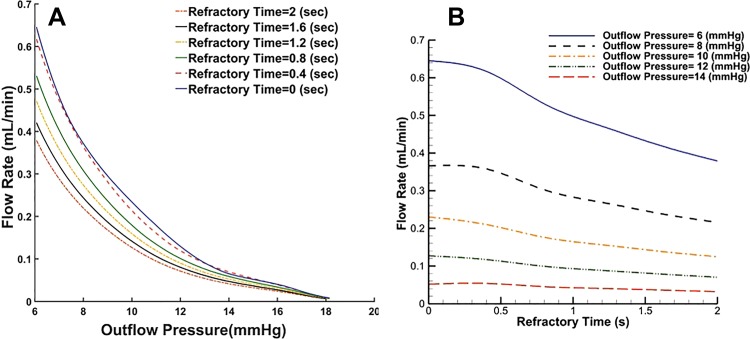
The intrinsic contraction of collecting lymphatic vessels serves as a pumping system to propel lymph against hydrostatic pressure gradients as it returns interstitial fluid to the venous circulation. In the present study, we proposed and validated that the maximum opposing outflow pressure along a chain of lymphangions at which flow can be achieved increases with the length of chain. Using minimally invasive near-infrared imaging to measure the effective pumping pressure at various locations in the rat tail, we demonstrated increases in pumping pressure along the length of the tail. Computational simulations based on a microstructurally motivated model of a chain of lymphangions informed from biaxial testing of isolated vessels was used to provide insights into the pumping mechanisms responsible for the pressure increases observed in vivo. These models suggest that the number of lymphangions in the chain and smooth muscle cell force generation play a significant role in determining the maximum outflow pressure, whereas the frequency of contraction has no effect. In vivo administration of nitric oxide attenuated lymphatic contraction, subsequently lowering the effective pumping pressure. Computational simulations suggest that the reduction in contractile strength of smooth muscle cells in the presence of nitric oxide can account for the reductions in outflow pressure observed along the lymphangion chain in vivo. Thus, combining modeling with multiple measurements of lymphatic pumping pressure provides a method for approximating intrinsic lymphatic muscle activity noninvasively in vivo while also providing insights into factors that determine the extent that a lymphangion chain can transport fluid against an adverse pressure gradient. NEW & NOTEWORTHY Here, we report the first minimally invasive in vivo measurements of the relationship between lymphangion chain length and lymphatic pumping pressure. We also provide the first in vivo validation of lumped parameter models of lymphangion chains previously developed through data obtained from isolated vessel testing.
Keywords: contractility; lymph transport; lymphedema; microstructure-constitutive models.
Figures


Similar articles
-
Lymphangion coordination minimally affects mean flow in lymphatic vessels.Am J Physiol Heart Circ Physiol. 2007 Aug;293(2):H1183-9. doi: 10.1152/ajpheart.01340.2006. Epub 2007 Apr 27. Am J Physiol Heart Circ Physiol. 2007. PMID: 17468331
-
Pump efficacy in a two-dimensional, fluid-structure interaction model of a chain of contracting lymphangions.Biomech Model Mechanobiol. 2021 Oct;20(5):1941-1968. doi: 10.1007/s10237-021-01486-w. Epub 2021 Jul 17. Biomech Model Mechanobiol. 2021. PMID: 34275062
-
Consequences of intravascular lymphatic valve properties: a study of contraction timing in a multi-lymphangion model.Am J Physiol Heart Circ Physiol. 2016 Apr 1;310(7):H847-60. doi: 10.1152/ajpheart.00669.2015. Epub 2016 Jan 8. Am J Physiol Heart Circ Physiol. 2016. PMID: 26747501 Free PMC article.
-
Mechanical forces and lymphatic transport.Microvasc Res. 2014 Nov;96:46-54. doi: 10.1016/j.mvr.2014.07.013. Epub 2014 Aug 5. Microvasc Res. 2014. PMID: 25107458 Free PMC article. Review.
-
Lymphatic pumping: mechanics, mechanisms and malfunction.J Physiol. 2016 Oct 15;594(20):5749-5768. doi: 10.1113/JP272088. Epub 2016 Aug 2. J Physiol. 2016. PMID: 27219461 Free PMC article. Review.
Cited by
-
Lymphatic Vessel Network Structure and Physiology.Compr Physiol. 2018 Dec 13;9(1):207-299. doi: 10.1002/cphy.c180015. Compr Physiol. 2018. PMID: 30549020 Free PMC article. Review.
-
A multiscale sliding filament model of lymphatic muscle pumping.Biomech Model Mechanobiol. 2021 Dec;20(6):2179-2202. doi: 10.1007/s10237-021-01501-0. Epub 2021 Sep 2. Biomech Model Mechanobiol. 2021. PMID: 34476656 Free PMC article.
-
Endothelin-1 inhibits size dependent lymphatic clearance of PEG-based conjugates after intra-articular injection into the rat knee.Acta Biomater. 2019 Jul 15;93:270-281. doi: 10.1016/j.actbio.2019.04.025. Epub 2019 Apr 12. Acta Biomater. 2019. PMID: 30986528 Free PMC article.
-
Characterization of rat tail lymphatic contractility and biomechanics: incorporating nitric oxide-mediated vasoregulation.J R Soc Interface. 2020 Sep;17(170):20200598. doi: 10.1098/rsif.2020.0598. Epub 2020 Sep 30. J R Soc Interface. 2020. PMID: 32993429 Free PMC article.
-
Lymphatic-draining nanoparticles deliver Bay K8644 payload to lymphatic vessels and enhance their pumping function.Sci Adv. 2023 Feb 24;9(8):eabq0435. doi: 10.1126/sciadv.abq0435. Epub 2023 Feb 24. Sci Adv. 2023. PMID: 36827374 Free PMC article.
References
-
- Bains SK, Stanton AWB, Cintolesi V, Ballinger J, Allen S, Zammit C, Levick JR, Mortimer PS, Peters AM, Purushotham AD. A constitutional predisposition to breast cancer-related lymphoedema and effect of axillary lymph node surgery on forearm muscle lymph flow. Breast 24: 68–74, 2015. doi:10.1016/j.breast.2014.11.010. - DOI - PubMed
Publication types
MeSH terms
Grants and funding
LinkOut - more resources
Full Text Sources
Other Literature Sources