Comparative Study
. 2017 Sep 15;292(37):15561-15576.
doi: 10.1074/jbc.M117.791343. Epub 2017 Aug 4.

Pyruvate kinase M knockdown-induced signaling via AMP-activated protein kinase promotes mitochondrial biogenesis, autophagy, and cancer cell survival

Affiliations
Comparative Study

Pyruvate kinase M knockdown-induced signaling via AMP-activated protein kinase promotes mitochondrial biogenesis, autophagy, and cancer cell survival

Gopinath Prakasam et al. J Biol Chem. .

Abstract

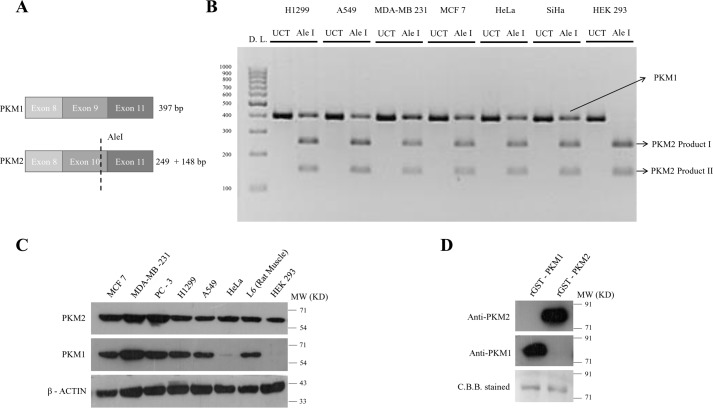
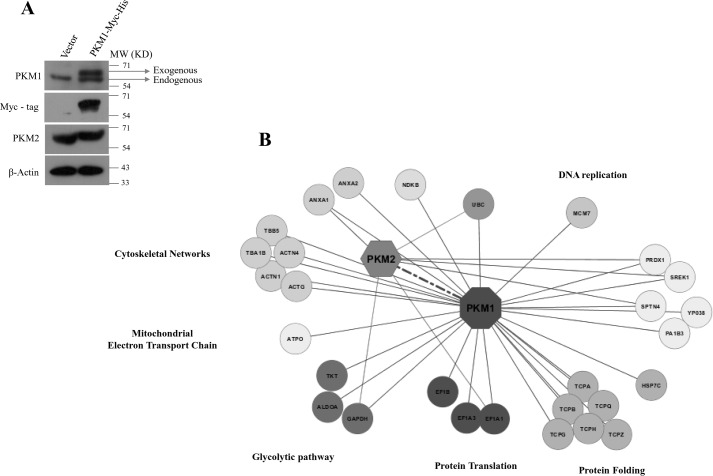
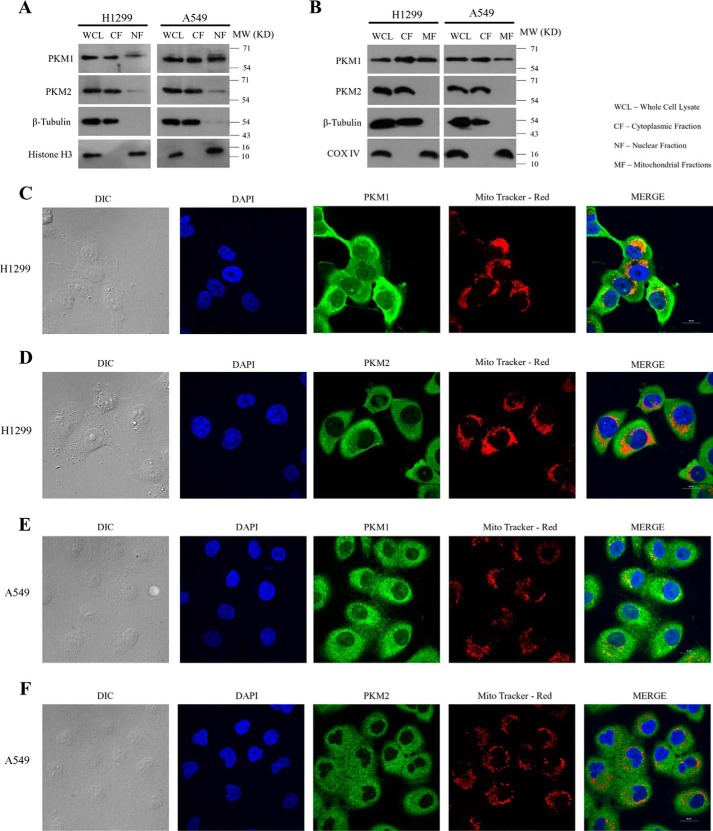
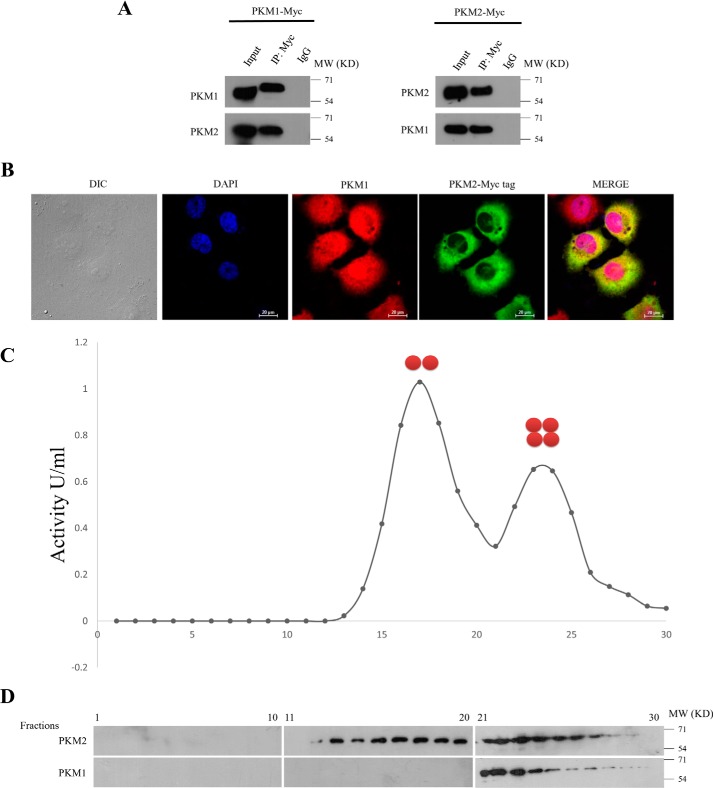
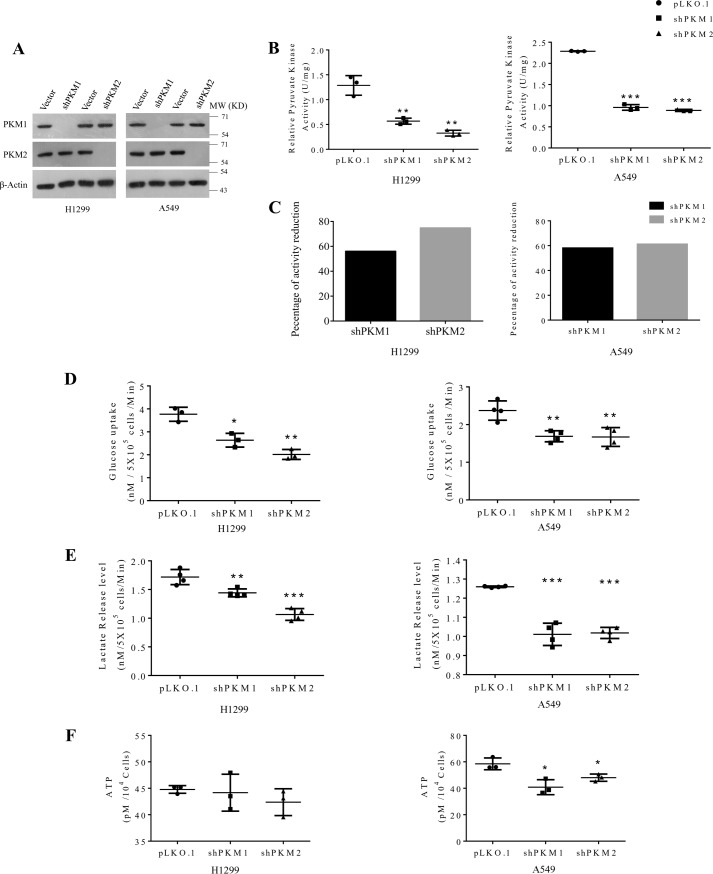
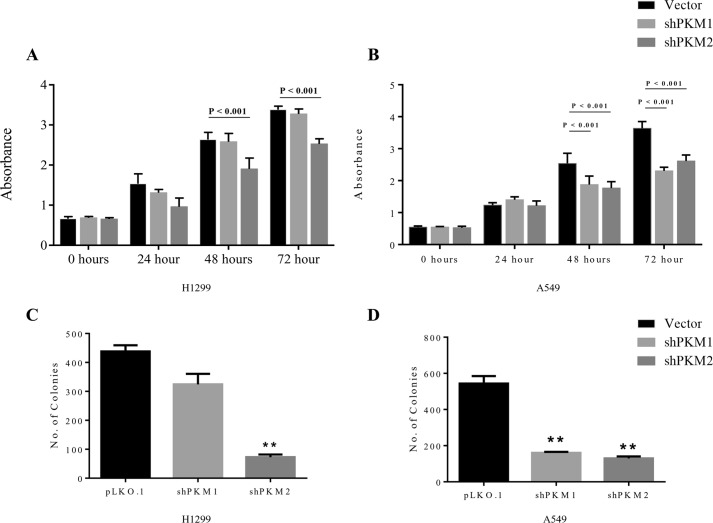
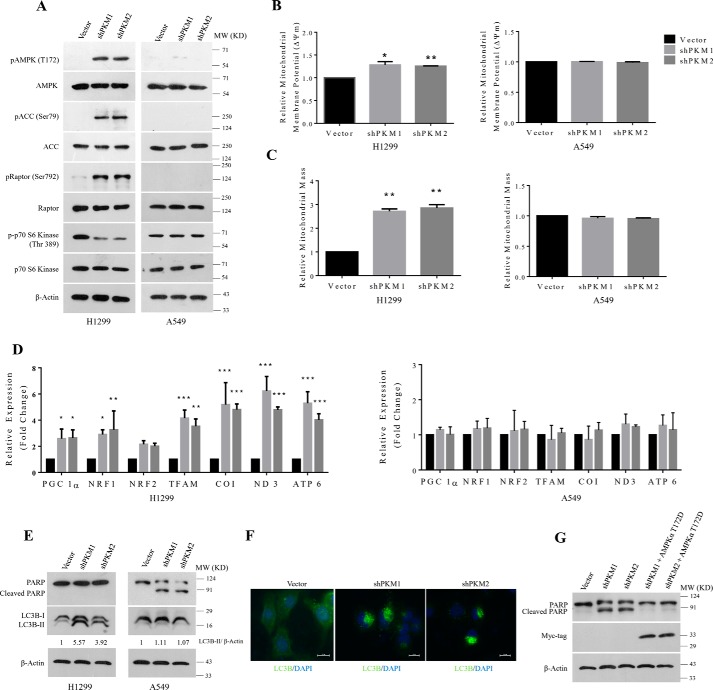
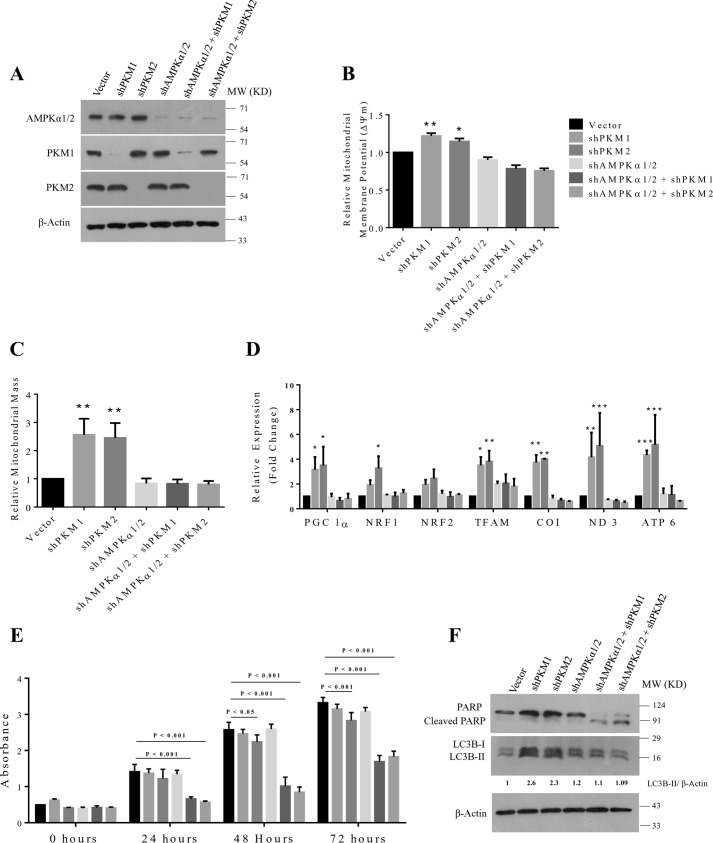
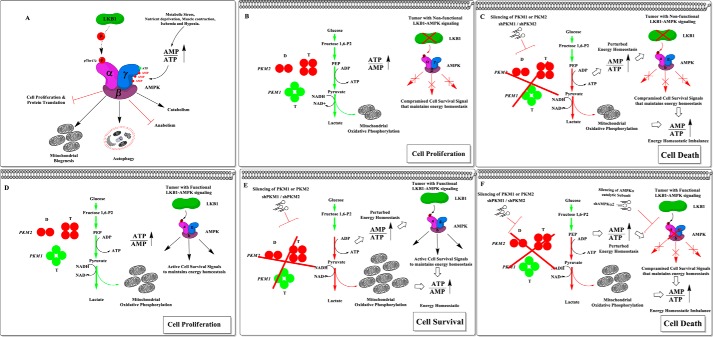
Preferential expression of the low-activity (dimeric) M2 isoform of pyruvate kinase (PK) over its constitutively active splice variant M1 isoform is considered critical for aerobic glycolysis in cancer cells. However, our results reported here indicate co-expression of PKM1 and PKM2 and their possible physical interaction in cancer cells. We show that knockdown of either PKM1 or PKM2 differentially affects net PK activity, viability, and cellular ATP levels of the lung carcinoma cell lines H1299 and A549. The stable knockdown of PK isoforms in A549 cells significantly reduced the cellular ATP level, whereas in H1299 cells the level of ATP was unaltered. Interestingly, the PKM1/2 knockdown in H1299 cells activated AMP-activated protein kinase (AMPK) signaling and stimulated mitochondrial biogenesis and autophagy to maintain energy homeostasis. In contrast, knocking down either of the PKM isoforms in A549 cells lacking LKB1, a serine/threonine protein kinase upstream of AMPK, failed to activate AMPK and sustain energy homeostasis and resulted in apoptosis. Moreover, in a similar genetic background of silenced PKM1 or PKM2, the knocking down of AMPKα1/2 catalytic subunit in H1299 cells induced apoptosis. Our findings help explain why previous targeting of PKM2 in cancer cells to control tumor growth has not met with the expected success. We suggest that this lack of success is because of AMPK-mediated energy metabolism rewiring, protecting cancer cell viability. On the basis of our observations, we propose an alternative therapeutic strategy of silencing either of the PKM isoforms along with AMPK in tumors.

Keywords: Warburg effect; cancer biology; cancer metabolism; cancer therapy; energy metabolism; mitochondria; mitochondrial oxidative phosphorylation; pyruvate kinase M1; pyruvate kinase M2.


Conflict of interest statement

The authors declare that they have no conflicts of interest with the contents of this article

Figures

Figure 1.
Figure 1.
Co-expression of PKM1 and PKM2 in cancer cell lines. A, schematic representation to depict the approach employed to assay PKM1/PKM2 mRNA ratio in human cancer cells as in B. B, semi-quantitative RT-PCR followed by PKM2 exon-specific restriction digestion with Ale I restriction enzyme to examine the proportion of PKM1 and PKM2 expression in human cancer cells. UCT, uncut; Ale I, restriction digested, and D.L., DNA Ladder. Uncut PKM1 and PKM2 397 bp, Ale I undigested PKM1 397 bp, Ale I digested PKM2 product I (249 bp), and Ale I digested PKM2 product II (148 bp). C, immunoblots of PKM1 and PKM2 to demonstrate co-expression of PKM1 and PKM2 isoforms in six human cancer cell lines of four different tissue origins and two noncancerous cell lines, used as a control. D, immunoblotting with anti-PKM1 and anti-PKM2 to show the specificity for purified recombinant PKM1 (rGST-PKM1) and PKM2 (rGST-PKM1), stained with Coomassie Brilliant Blue (C.B.B.).
Figure 2.
Figure 2.
Identification of protein interacting partners of human PKM1 using LC-MS-MS. A, immunoblots of Myc-His–tagged PKM1 and PKM2 from the protein lysates of H1299 stable cells, transfected with empty vector or Myc-His–tagged PKM1 cDNA. B, cytoscape map of PKM1 interactome, involving a total of 30 interacting partners of PKM1, co-immunoprecipitated with Myc-tagged PKM1 from H1299 lysate and identified using LC-MS-MS from two biological replicates. The identified interacting partners were further separated with distinct color codes and were marked as entities that were an integral part of cellular machinery, such as glycolytic pathway, mitochondrial electron transport chain, protein translational, protein folding, DNA replication, and cytoskeletal networks.
Figure 3.
Figure 3.
Subcellular localization of PKM isoforms and their validation. A, immunoblots of PKM1 and PKM2 from the lysate of H1299 (left panel) and A549 (right panel) cells collected by fractionating the cytoplasm and the nucleus (WCL, whole cell lysate; CF, cytoplasmic fraction; and NF, nuclear fraction). PARP and β-tubulin served as loading controls for nucleus, and cytoplasm respectively. B, immunoblots of PKM1 and PKM2 from lysate of H1299 (left panel) and A549 (right panel) cells collected by fractionating the cytoplasm and the mitochondria (WCL, whole cell lysate; CF, cytoplasmic fraction; MF, mitochondrial fraction). COX IV and β-tubulin served as loading controls for mitochondria and cytoplasm, respectively. C–F, confocal microscopy images demonstrating the subcellular localization of PKM1 or PKM2 in H1299 and A549 cells, immunostained with antibodies of PKM2 (green) or PKM1 (green), mitochondria stained with Mito-tracker Red (red) and the nucleus was stained with DAPI (blue). Merged figures are shown with a scale bar of 20 μm.
Figure 4.
Figure 4.
PKM1 and PKM2 interact with each other. A, immunoprecipitation (IP) performed with anti-Myc-tag in lysates of H1299 cells, stably expressing Myc-tagged PKM1 (PKM1-Myc) (left panel), or Myc-tagged PKM2 (PKM2-Myc) (right panel), followed by immunoblotting with PKM1 or PKM2 antibodies, to show the interaction between PKM-isoforms (IgG used as isotype control). B, confocal microscopy images, displaying the co-localization of endogenous PKM1 (immunostained with anti-PKM1 and secondary anti-Alexa Fluor 589 red) and exogenously expressed Myc-tagged PKM2 (immunostained with anti-Myc-tag and secondary anti-Alexa Fluor 488 green) in H1299 cells. Nucleus was stained with DAPI (blue); figures are shown with a scale bar of 20 μm. C, dimeric and tetrameric peaks of PKM, resolved by examining pyruvate kinase activity from the fractions collected after glycerol density gradient ultracentrifugation, loaded with protein lysates from H1299 cells. D, immunoblotting with anti-PKM1 and anti-PKM2 of the glycerol density gradient fractions as mentioned in C to measure the distribution of PKM1 and PKM2 in the separated peaks in C.
Figure 5.
Figure 5.
Knockdown of PKM1 or PKM2 differentially affects the metabolism of human lung cancer cells H1299 and A549. A, immunoblots to validate the stable knockdown of PKM1 and PKM2 expression in H1299 (left panel) and A549 (right panel) cells, transduced with vector control (pLKO.1), shPKM1, or shPKM2. B, relative pyruvate kinase enzyme activity from protein lysates of H1299 (left panel) and A549 (right panel) cells stably transduced with control vector (pLKO.1), shPKM1, or shPKM2; with statistical analysis (where n ≥ 3; mean ± S.D.), and the level of significance was tested using unpaired Student's t test. **, p < 0.01; ***, p < 0.001. C, bar diagrams showing a relative reduction in the percentage of pyruvate kinase activity after silencing of PKM1 and PKM2 in H1299 (left panel) and A549 (right panel) cells. D–F, glucose uptake (D), lactate release (E), and intracellular ATP (F) levels in H1299 (left panel) and A549 (right panel) cells stably transduced with vector (pLKO.1), shPKM1, or shPKM2; with statistical analysis (where n ≥ 3; mean ± S.D.) and the level of significance was tested using unpaired Student's t test. *, p < 0.05; **, p < 0.01; ***, p < 0.001.
Figure 6.
Figure 6.
PKM1 or PKM2 silencing differentially affects the viability of H1299 and A549 (human lung cancer cells). A and B, CCK8 assay to examine the viability of H1299 cells (A) and A549 cells (B), transduced with vector (pLKO.1), shPKM1, or shPKM2 and cultured for the period of 72 h, the cellular viability assayed for every 24 h; with statistical analysis (where n ≥ 3; mean ± S.D.), and the level of significance was tested using two-way analysis of variance with Tukey's multiple comparisons test. C and D, bars represent the number of colonies obtained from the anchorage-dependent clonogenic assay of H1299 (C) and A549 (D) stable cells transduced with lentivirus containing empty vector (pLKO.1), shPKM1, or shPKM2; with statistical analysis (where n ≥ 3; mean ± S.D.), and the level of significance was tested using unpaired Student's t test.*, p < 0.01.
Figure 7.
Figure 7.
AMPK signaling reprograms energy metabolism pathway to sustain energy homeostasis and to prevent apoptotic cell death. A, immunoblots from the protein lysate of H1299 (left panel) and A549 (right panel) cells stably transduced with lentivirus containing control vector (pLKO.1), shPKM1, or shPKM2, to show AMPK signaling activation. B and C, bar diagram depicts the relative mitochondrial membrane potential (B) and mitochondrial mass (C) in H1299 (left panels) and A549 (right panels) cells stably transduced with control vector (pLKO.1), shPKM1, or shPKM2; with statistical analysis (where n ≥ 3; mean ± S.D.), and the level of significance was tested using unpaired Student's t test. *, p < 0.05; **, p < 0.01. D, quantitative RT-PCR analysis to show the relative expression change of genes involved in the mitochondrial biogenesis (PGC 1α, NRF1, NRF2, and TFAM) and mitochondrial-encoded subunits of electron transport chain complexes (COX 1, ND3, and ATP6) from H1299 (left) and A549 (right) cells for stable PKM1 and PKM2 knockdown. The bars represent the -fold change after normalizing with the control of each group (vector transfected); with statistical analysis (where n ≥ 3; mean ± S.D.) and the level of significance was tested using two-way analysis of variance with Tukey's multiple comparisons test. *, p < 0.05; **, p < 0.01; ***, p < 0.001. E, immunoblots from the protein lysate of H1299 (left panel) and A549 (right panel) cells transduced with lentivirus containing empty vector (pLKO.1), shPKM1, or shPKM2 to measure autophagy and apoptosis using LC3B-II and cleaved PARP as markers. F, confocal microscopy images depicting the autophagic puncta formation in H1299 cells stably transduced with shPKM1 and shPKM2, immunostained with LC3B antibody and secondary anti-Alexa Fluor 488. Nucleus was stained with DAPI (blue). Merged figures are shown with a scale bar of 20 μm. G, immunoblot from the protein lysate of A549 cells, transduced with lentivirus containing empty vector (pLKO.1), shPKM1, shPKM2, and, in addition, ectopic expression of Myc-tagged AMPKα2 constitutively active T172D mutant (AMPKα2T172D-Myc) in cells knocked down for PKM1 and PKM2 probed with Myc-tag and PARP antibodies to validate the expression of AMPKα2T172D-Myc and to measure apoptosis.
Figure 8.
Figure 8.
AMPKα2 and PKM1 or PKM2 dual knockdown induces cell death in H1299 cells by preventing energy metabolism reprogramming. A, immunoblots from the protein lysate of H1299 cells stably transduced with control vector (pLKO. 1), shPKM1, shPKM2, shAMPKα1/2, and shAMPKα1/2 + shPKM1 or + shPKM2 to validate the knockdown of AMPKα1/2, PKM1, and PKM2. B and C, bar diagram depicts the relative mitochondrial membrane potential (B) and mitochondrial mass (C) in H1299 cells stably transduced with control vector (pLKO.1), shPKM1, shPKM2, shAMPKα1/2, and shAMPKα1/2 + shPKM1 or + shPKM2; with statistical analysis (where n ≥ 3; mean ± S.D.), and the level of significance was tested using unpaired Student's t test. *, p < 0.05, **, p < 0.01. D, quantitative RT-PCR analysis to show the relative expression change of genes involved in the mitochondrial biogenesis (PGC 1α, NRF1, NRF2, and TFAM) and mitochondrial-encoded subunits of electron transport chain complexes (COX 1, ND3, and ATP6) from H1299 cells for stable shPKM1, shPKM2, AMPKα1/2, or AMPKα1/2 and PKM1 or PKM2 knockdown. The bars represent the -fold change after normalizing with the control of each group (vector transfected); with statistical analysis (where n ≥3; mean ± S.D.), and the level of significance was tested using two-way analysis of variance with Tukey's multiple comparisons test. *, p < 0.05; **, p < 0.01; ***, p < 0.001. E, CCK8 assay to examine the viability rate of H1299 cells stably transduced with control vector (pLKO.1), shPKM1, shPKM2, shAMPKα1/2, and shAMPKα1/2 and shPKM1 or shPKM2 and cultured for the period of 72 h. Cellular viability rates were assayed for every 24 h; with statistical analysis (where n ≥ 3; mean ± S.D.), and the level of significance was tested using two-way analysis of variance with Tukey's multiple comparisons test. F, immunoblots from the protein lysate of H1299 as mentioned in (A) to measure autophagy and apoptosis using LC3B-II and cleaved PARP as markers.
Figure 9.
Figure 9.
Schematic representation of the proposed therapeutic strategy to improve the efficacy of PKM targeting therapy in cancer cells in the background of the cellular status of the LKB1-AMPK pathway. A, the effect of the bioenergetic sensor, LKB1-AMPK signaling on cellular metabolic pathways to preserve energy homeostasis. B, the pro-growth metabolic phenotype of tumor cells that lacks or expresses a nonfunctional LKB1 (i.e. somatic mutation, promoter hypermethylation, or exonic deletion) and thus fails to activate the bio-energetic sensor AMPK. C, the therapeutic efficacy of PKM2 or PKM1 silencing in tumor cells that lack LKB1-AMPK signaling pathway to rewire metabolic phenotype and to restore the perturbed ATP level. D, the metabolic phenotype of tumor cells that possess the intact bio-energetic sensors, LKB1-AMPK signaling pathway. E, the mechanistic insight of LKB1-AMPK mediated metabolic rewiring and the restored energy homeostasis that confers treatment resistance against PKM silencing in cancer cells. F, the proposed therapeutic scheme of inducing synthetic lethality in cancer cells by targeting the pro-growth metabolism by silencing PKM isoforms and reducing resistance toward apoptosis by targeting the AMPK pathway.

Similar articles

Cited by

References

    1. Warburg O. (1956) On the origin of cancer cells. Science 123, 309–314 - PubMed
    1. Vander Heiden M. G., Cantley L. C., and Thompson C. B. (2009) Understanding the Warburg effect: The metabolic requirements of cell proliferation. Science 324, 1029–1033 - PMC - PubMed
    1. Cairns R. A., Harris I. S., and Mak T. W. (2011) Regulation of cancer cell metabolism. Nat. Rev. Cancer 11, 85–95 - PubMed
    1. Christofk H. R., Vander Heiden M. G., Harris M. H., Ramanathan A., Gerszten R. E., Wei R., Fleming M. D., Schreiber S. L., and Cantley L. C. (2008) The M2 splice isoform of pyruvate kinase is important for cancer metabolism and tumour growth. Nature 452, 230–233 - PubMed
    1. Mazurek S. (2011) Pyruvate kinase type M2: A key regulator of the metabolic budget system in tumor cells. Int. J. Biochem. Cell Biol. 43, 969–980 - PubMed

MeSH terms