. 2017 Sep 4;214(9):2611-2628.
doi: 10.1084/jem.20160999. Epub 2017 Aug 4.

Progranulin deficiency causes impairment of autophagy and TDP-43 accumulation

Affiliations

Progranulin deficiency causes impairment of autophagy and TDP-43 accumulation

Michael C Chang et al. J Exp Med. .

Abstract

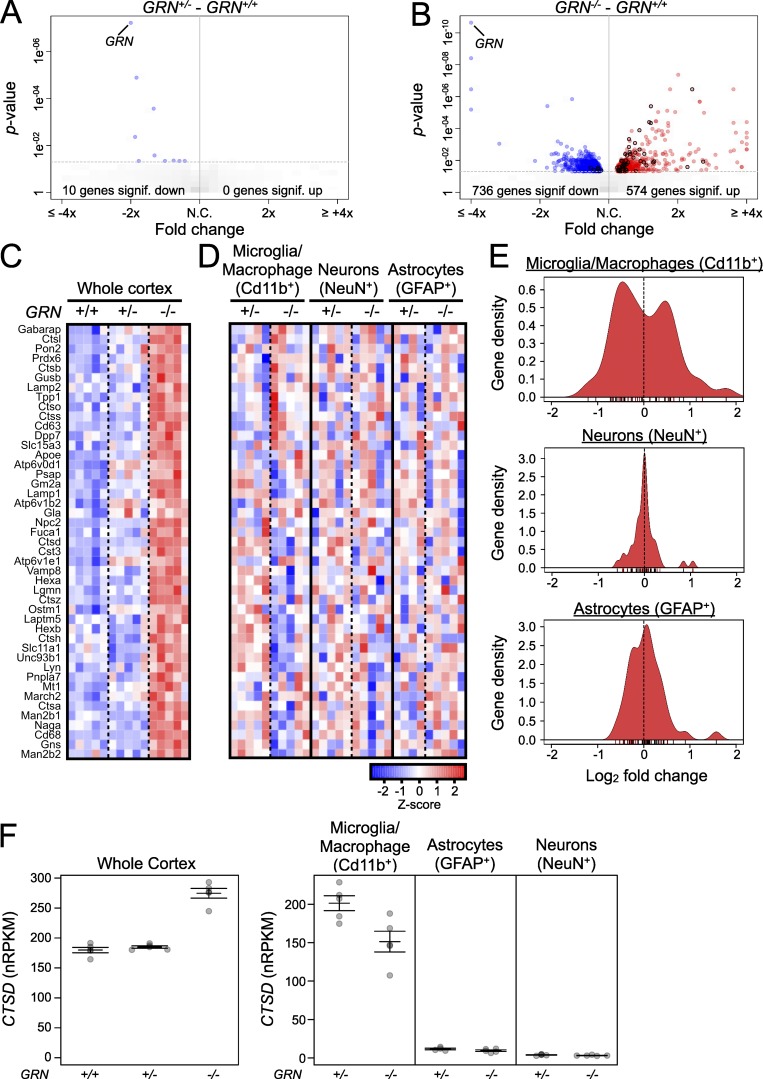
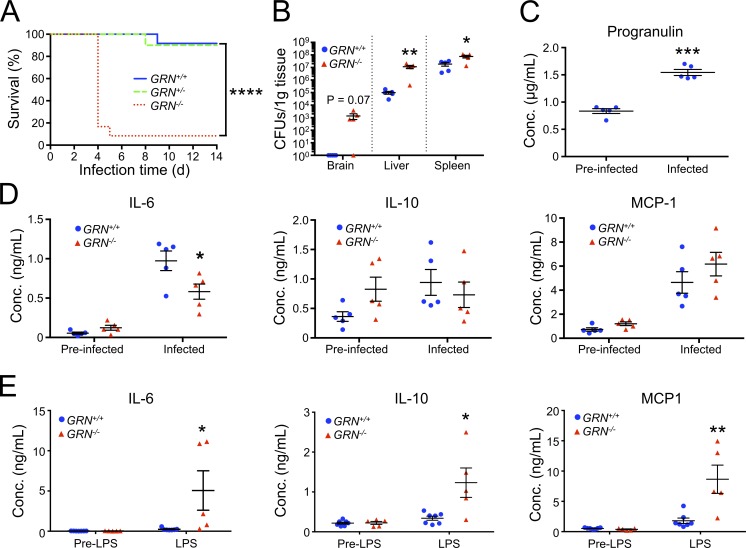
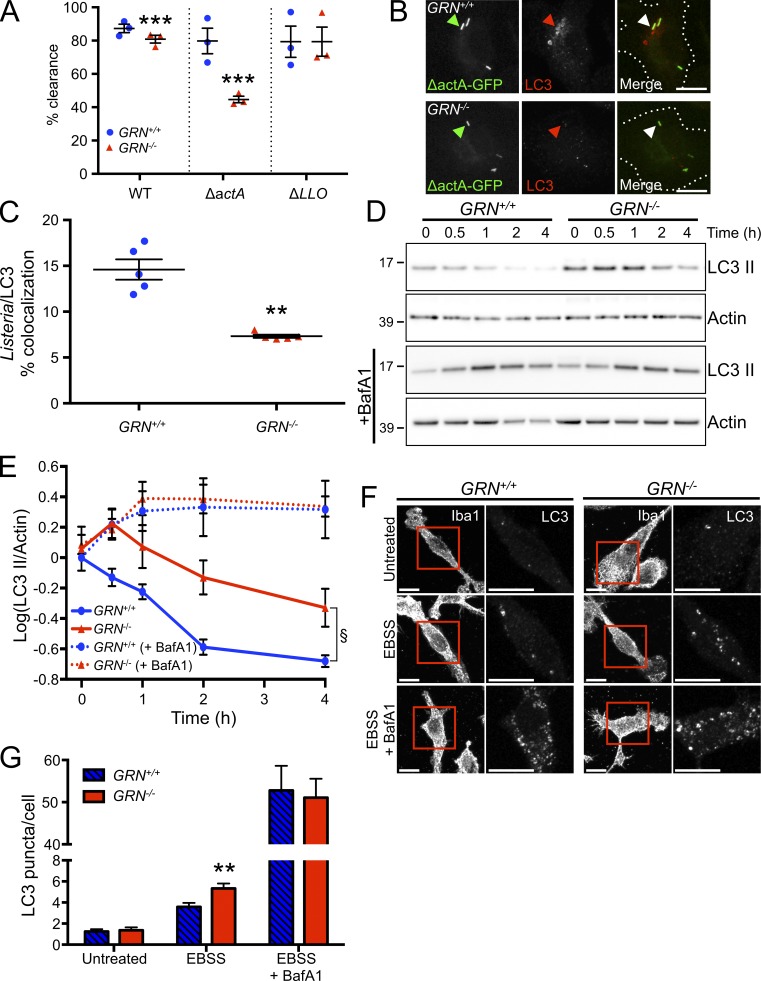
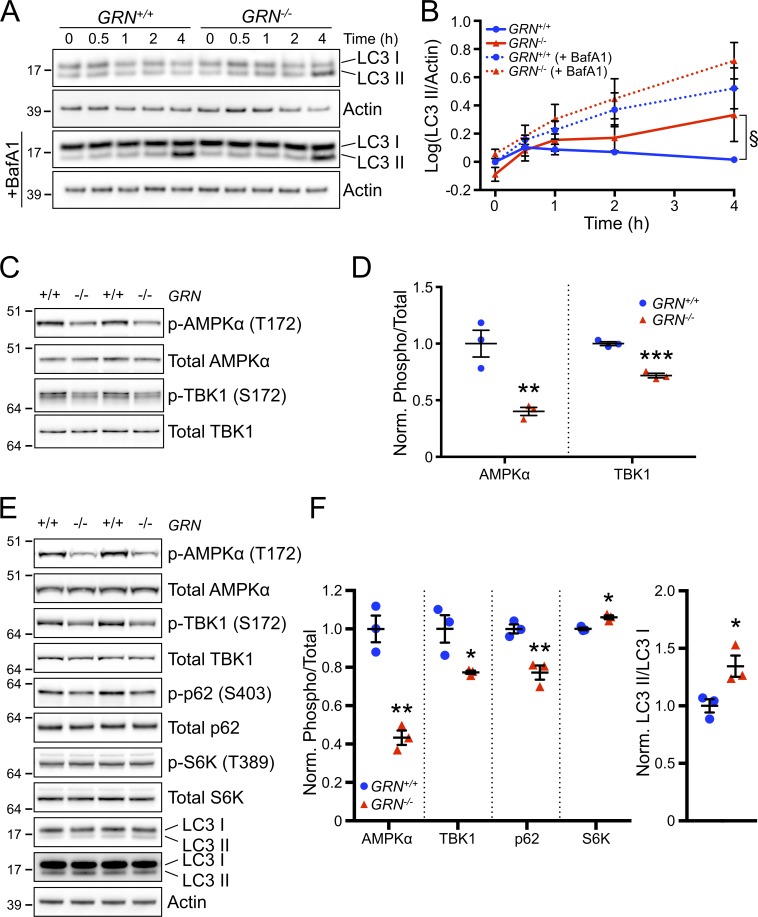
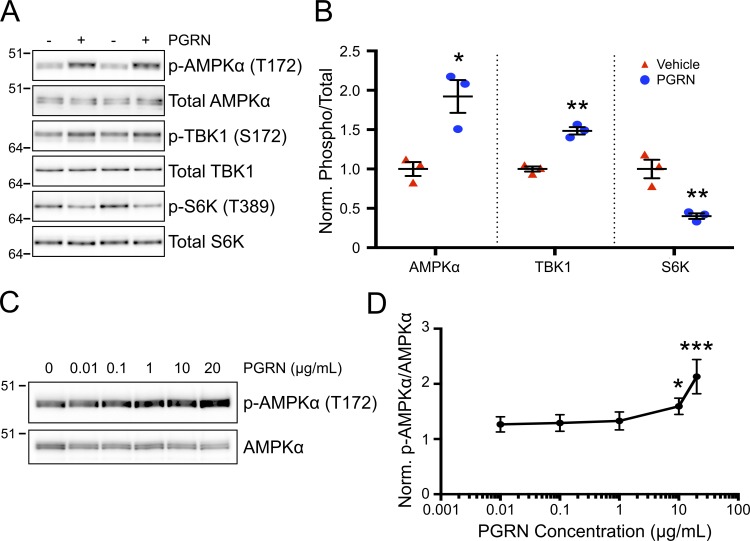
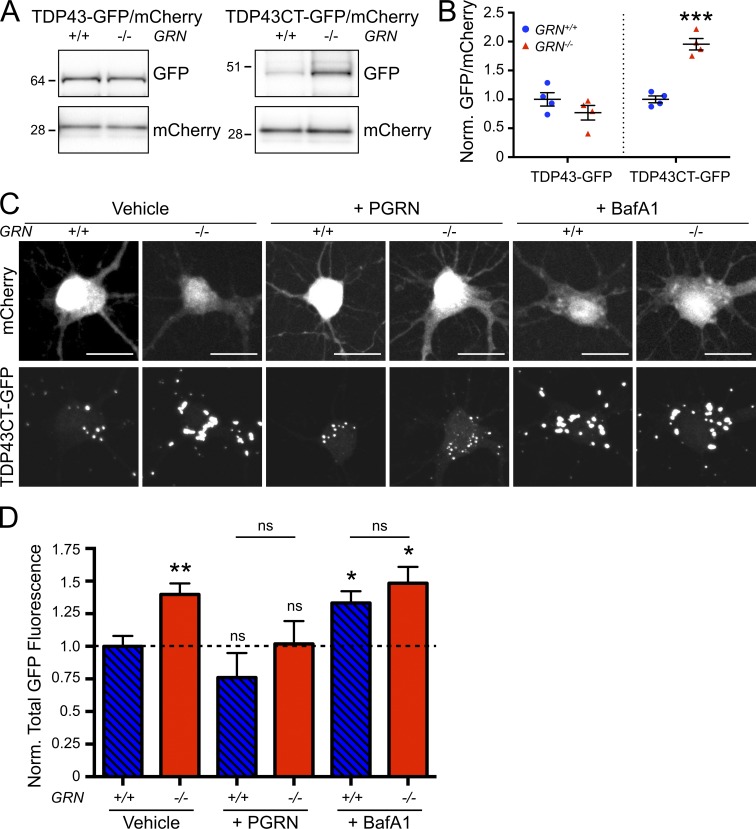
Loss-of-function mutations in GRN cause frontotemporal dementia (FTD) with transactive response DNA-binding protein of 43 kD (TDP-43)-positive inclusions and neuronal ceroid lipofuscinosis (NCL). There are no disease-modifying therapies for either FTD or NCL, in part because of a poor understanding of how mutations in genes such as GRN contribute to disease pathogenesis and neurodegeneration. By studying mice lacking progranulin (PGRN), the protein encoded by GRN, we discovered multiple lines of evidence that PGRN deficiency results in impairment of autophagy, a key cellular degradation pathway. PGRN-deficient mice are sensitive to Listeria monocytogenes because of deficits in xenophagy, a specialized form of autophagy that mediates clearance of intracellular pathogens. Cells lacking PGRN display reduced autophagic flux, and pathological forms of TDP-43 typically cleared by autophagy accumulate more rapidly in PGRN-deficient neurons. Our findings implicate autophagy as a novel therapeutic target for GRN-associated NCL and FTD and highlight the emerging theme of defective autophagy in the broader FTD/amyotrophic lateral sclerosis spectrum of neurodegenerative disease.


Figures

Figure 1.
Figure 1.
Altered expression of lysosome-associated genes in brain and microglia/macrophages of GRN−/− mice. (A and B) Volcano plots (fold-change vs. p-value) of altered gene expression in whole cerebral cortex of heterozygous GRN+/− mice (A) or homozygous GRN−/− mice (B) relative to WT GRN+/+ mice (all 12 months old). Blue circles represent significantly down-regulated genes, and red circles represent significantly up-regulated genes. Circles with black outlines show genes with significant changes in expression from lysosome cellular component GO term (GO:0005764). n = 5 mice per group from one experiment. Significance cutoff at P < 0.05 using voom/limma. N.C., no change. (C) Heat map illustrating expression of a subset of lysosome-associated genes in whole cortex of GRN+/+, GRN+/−, and GRN−/− mice. The genes shown are those that were up in the GRN−/− cortex relative to GRN+/+ cortex and are members of lysosome cellular component GO term (GO:0005764; i.e., red circles with black outlines from B). n = 5 mice per group from one experiment. (D) Heat map showing expression of the same set of lysosome-associated genes shown in C in sorted microglia/macrophages, neurons, and astrocytes from GRN+/− and GRN−/− mice. Gene expression was normalized separately within each cell type. n = 5 mice from five experiments for all groups except GRN+/− astrocytes (n = 4 mice). (E) Gene density versus fold change plot of the data shown in D. n = 5 mice from five experiments for all groups except GRN+/− astrocytes (n = 4 mice). (F) Normalized reads per kilobase of transcript per million mapped reads (nRPKM) of cathepsin D (CTSD) in whole GRN+/+, GRN+/−, and GRN−/− cortex (left) and sorted microglia/macrophages, astrocytes, and neurons from GRN+/−, and GRN−/− cortex (right). n = 5 mice from five experiments for all groups except GRN+/− astrocytes (n = 4 mice). Error bars represent mean ± SEM.
Figure 2.
Figure 2.
Impaired defense against Listeria monocytogenes in mice lacking PGRN. (A) 14-d survival curve of GRN+/+ (solid blue line), GRN+/− (dashed green line), and GRN−/− (dotted red line) mice after intravenous L. monocytogenes infection. n = 12 mice per group from one experiment. ****, P < 0.0001 GRN+/+ versus GRN−/− using a log-rank test. (B) L. monocytogenes burden in GRN+/+ (blue circles) and GRN−/− (red triangles) mice 2 d after infection. n = 5 mice per group from one experiment. *, P < 0.05 and **, P < 0.01 versus GRN+/+ using an unpaired t test with Welch’s correction. (C) Serum PGRN levels in response to L. monocytogenes infection. n = 5 mice per group from one experiment. ***, P < 0.001 versus pre-infected using a paired t test. (D) Serum IL-6, IL-10, and MCP-1 levels in GRN+/+ (circles) and GRN−/− (triangles) mice after intravenous L. moncytogenes infection. n = 5 mice per group from one experiment. *, P < 0.05 versus GRN+/+ using an unpaired t test. (E) Serum IL-6, IL-10, and MCP-1 levels in GRN+/+ (circles) and GRN−/− (triangles) mice after treatment with LPS. n = 5 mice per group from one experiment. *, P < 0.05 and **, P < 0.01 using an unpaired t test. Error bars represent mean ± SEM.
Figure 3.
Figure 3.
Impaired xenophagy in macrophages from GRN−/− mice. (A) L. monocytogenes clearance assay of BMDMs from GRN+/+ (blue circles) and GRN−/− mice (red triangles) in response to the indicated strain of L. monocytogenes. n = 3 independent experiments, with each experiment performed in quadruplicate (mean value of each independent experiment plotted in graph). ***, P < 0.001 versus GRN+/+, using a linear least squares regression analysis. (B) Representative micrographs from n = 5 independent experiments showing BMDMs from GRN+/+ (top row) and GRN−/− (bottom) mice infected with GFP-labeled ΔactA L. monocytogenes (left) and stained for LC3 (middle). Example bacteria are marked with an arrowhead. Bars, 10 µm. (C) Quantification of L. monocytogenes/LC3 colocalization from experiments as shown in B. n = 5 independent experiments. **, P < 0.01 versus GRN+/+ using an unpaired t test. (D) Representative Western blot from n = 4 independent experiments of cell lysates from GRN+/+ and GRN−/− BMDMs starved for the indicated time in the absence (top row) and presence (middle row) of 100 nM bafilomycin A1 and probed for LC3 and actin. The actin (loading control) immunoblots shown in Figs. 3 D and S2 A are identical; this actin immunoblot, as well as LC3 (Fig. 3 D) and p62 (Fig. S2 A), were obtained by reprobing of the same Western blot. Molecular mass is indicated in kilodaltons. (E) Quantification of LC3 II levels from experiments as in D. n = 4 independent experiments. §, P = 0.0028 for GRN−/− versus GRN+/+ using two-way ANOVA and Dunnett’s multiple comparisons test (0.5 h = P < 0.01, 1 h = P < 0.05, 2 h = P < 0.0001, and 4 h = P < 0.01). (F) Representative images from n = 3 independent experiments of GRN+/+ (left) and GRN−/− (right) BMDMs treated with the indicated compounds before staining for LC3. Bars, 10 µm. (G) Quantification of number of LC3 puncta per cell from experiments as shown in F. n = 56, 47, 39, 60, 67, 65 cells from three independent experiments for the groups listed left to right. **, P < 0.01 versus GRN+/+ using a Mann–Whitney U test. Error bars represent mean ± SEM. EBSS, Earle’s balanced salt solution.
Figure 4.
Figure 4.
Impaired autophagy and autophagy signaling in GRN−/− neurons. (A) Representative Western blot from n = 3 independent experiments of cell lysates from GRN+/+ and GRN−/− cortical neurons starved for the indicated times in the absence (top rows) or presence (bottom) of 100 nM bafilomycin A1 and probed for LC3 and actin. (B) Quantification of LC3 II levels from experiments as in A. n = 3 independent experiments. §, P = 0.038 for GRN−/− versus GRN+/+ using two-way ANOVA and Dunnett’s multiple comparisons test (0.5 h = not significant [n.s.], 1 h = P < 0.05, 2 h = P < 0.01, and 4 h = P < 0.0001). (C) Representative Western blot from n = 3 independent experiments of cell lysates from cultured GRN+/+ and GRN−/− cortical neurons probed with the indicated antibodies. (D) Quantification of phosphorylated/total signal for AMPK and TBK1 from experiments as shown in C. n = 3 independent experiments. **, P < 0.01 and ***, P < 0.001 versus GRN+/+ using unpaired t test. (E) Representative Western blot of whole cortex from ∼18-mo-old GRN+/+ and GRN−/− mice probed with the indicated antibodies. n = 3 mice per group from one experiment. (A, C, and E) Molecular mass is indicated in kilodaltons. (F) Quantification of phosphorylated/total signals for the indicated proteins (left) and LC3 II/LC3 I signal (right) from experiments as shown in E. n = 3 mice per group from one experiment. *, P < 0.05 and **, P < 0.01 using an unpaired t test. Error bars represent mean ± SEM.
Figure 5.
Figure 5.
Stimulation of autophagy signaling by PGRN. (A) Representative Western blot from n = 3 independent experiments of cell lysates from GRN−/− cortical neurons untreated or with 10 µg/ml recombinant mouse PGRN or vehicle and probed with the indicated antibodies. (B) Quantification of phosphorylated/total protein signals for the indicated proteins from experiments as shown in A. n = 3 independent experiments. *, P < 0.05 and **, P < 0.01 versus GRN+/+ using an unpaired t test. (C) Dose–response relationship for PGRN stimulation of AMPKα phosphorylation. Representative Western blot from n = 3 independent experiments of GRN−/− cortical cultures treated with the indicated concentrations of recombinant mPGRN and probed with the indicated antibodies. (A and C) Molecular mass is indicated in kilodaltons. (D) Quantification of phospho-AMPKα /total AMPKα signal from experiments as shown in C. n = 3 independent experiments. *, P < 0.05 and ***, P < 0.001 versus untreated using one-way ANOVA with Dunnett’s multiple comparisons test. Error bars represent mean ± SEM.
Figure 6.
Figure 6.
Accelerated accumulation of pathogenic TDP-43 in GRN−/− neurons. (A) Representative Western blot from n = 4 independent experiments of GRN+/+ and GRN−/− cortical cultures infected with AAV expressing mCherry along with either full-length TDP43-GFP (left) or TDP43CT-GFP (right) and probed with the indicated antibodies. Molecular mass is indicated in kilodaltons. (B) Quantification of GFP/mCherry signal from experiments as shown in A. n = 4 independent experiments. ***, P < 0.001 versus GRN+/+ using an unpaired t test. (C) Representative images of GRN+/+ and GRN−/− hippocampal neurons cotransfected with mCherry (top row) and TDP43CT-GFP (bottom) and treated with vehicle (DMSO; left), 10 µM PGRN (middle), or 100 nM bafilomycin A1 (right). n = 158, 173, 37, 69, 147, and 96 cells per genotype and condition from eight, eight, three, three, eight, and eight independent experiments for the groups listed left to right. Bars, 25 µm. (D) Quantification of total GFP fluorescence per cell from experiments as shown in A. Data were normalized to the mean of GRN+/+ vehicle-treated cells. n = 158, 173, 37, 69, 147, and 96 cells per genotype and condition from eight, eight, three, three, eight, and eight independent experiments for the groups listed left to right. *, P < 0.05 and **, P < 0.01 versus vehicle-treated GRN+/+ using Kruskal–Wallis one-way ANOVA with Dunn’s multiple comparisons test. Error bars represent mean ± SEM. ns, not significant.

References

    1. Ahmed Z., Sheng H., Xu Y.-F., Lin W.-L., Innes A.E., Gass J., Yu X., Wuertzer C.A., Hou H., Chiba S., et al. . 2010. Accelerated lipofuscinosis and ubiquitination in granulin knockout mice suggest a role for progranulin in successful aging. Am. J. Pathol. 177:311–324. 10.2353/ajpath.2010.090915 - DOI - PMC - PubMed
    1. Almeida M.R., Macário M.C., Ramos L., Baldeiras I., Ribeiro M.H., and Santana I.. 2016. Portuguese family with the co-occurrence of frontotemporal lobar degeneration and neuronal ceroid lipofuscinosis phenotypes due to progranulin gene mutation. Neurobiol. Aging. 41:200.e1–200.e5. 10.1016/j.neurobiolaging.2016.02.019 - DOI - PubMed
    1. Anakwe O.O., and Gerton G.L.. 1990. Acrosome biogenesis begins during meiosis: evidence from the synthesis and distribution of an acrosomal glycoprotein, acrogranin, during guinea pig spermatogenesis. Biol. Reprod. 42:317–328. 10.1095/biolreprod42.2.317 - DOI - PubMed
    1. Baker M., Mackenzie I.R., Pickering-Brown S.M., Gass J., Rademakers R., Lindholm C., Snowden J., Adamson J., Sadovnick A.D., Rollinson S., et al. . 2006. Mutations in progranulin cause tau-negative frontotemporal dementia linked to chromosome 17. Nature. 442:916–919. 10.1038/nature05016 - DOI - PubMed
    1. Barmada S.J., Serio A., Arjun A., Bilican B., Daub A., Ando D.M., Tsvetkov A., Pleiss M., Li X., Peisach D., et al. . 2014. Autophagy induction enhances TDP43 turnover and survival in neuronal ALS models. Nat. Chem. Biol. 10:677–685. 10.1038/nchembio.1563 - DOI - PMC - PubMed