

Improving the phenotype predictions of a yeast genome-scale metabolic model by incorporating enzymatic constraints
- PMID: 28779005
- PMCID: PMC5572397
- DOI: 10.15252/msb.20167411
Improving the phenotype predictions of a yeast genome-scale metabolic model by incorporating enzymatic constraints
Abstract
Genome-scale metabolic models (GEMs) are widely used to calculate metabolic phenotypes. They rely on defining a set of constraints, the most common of which is that the production of metabolites and/or growth are limited by the carbon source uptake rate. However, enzyme abundances and kinetics, which act as limitations on metabolic fluxes, are not taken into account. Here, we present GECKO, a method that enhances a GEM to account for enzymes as part of reactions, thereby ensuring that each metabolic flux does not exceed its maximum capacity, equal to the product of the enzyme's abundance and turnover number. We applied GECKO to a Saccharomyces cerevisiae GEM and demonstrated that the new model could correctly describe phenotypes that the previous model could not, particularly under high enzymatic pressure conditions, such as yeast growing on different carbon sources in excess, coping with stress, or overexpressing a specific pathway. GECKO also allows to directly integrate quantitative proteomics data; by doing so, we significantly reduced flux variability of the model, in over 60% of metabolic reactions. Additionally, the model gives insight into the distribution of enzyme usage between and within metabolic pathways. The developed method and model are expected to increase the use of model-based design in metabolic engineering.
Keywords: Saccharomyces cerevisiae; enzyme kinetics; flux balance analysis; molecular crowding; proteomics.
© 2017 The Authors. Published under the terms of the CC BY 4.0 license.
Figures
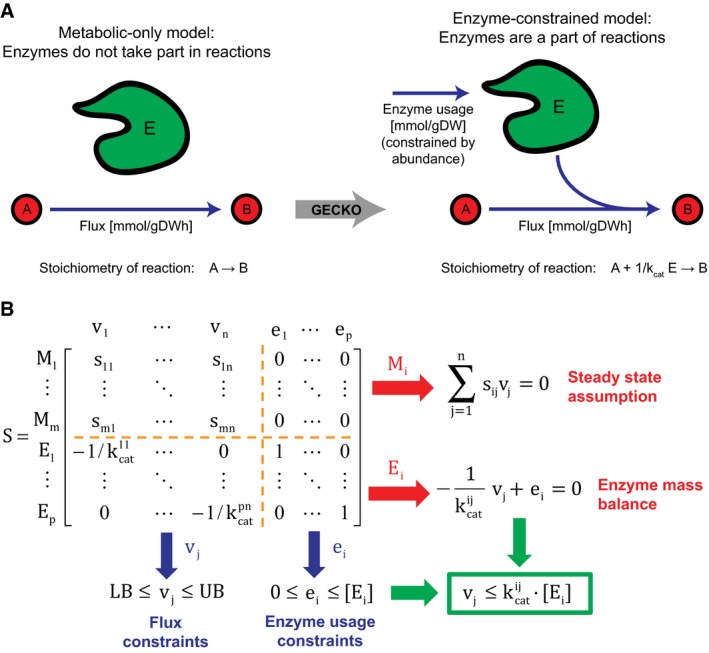
GECKO uses a genome‐scale model and includes enzymes as part of reactions.
Expansion of the stoichiometric matrix. M refers to metabolites, E to enzymes, v to metabolic fluxes, and e to enzyme usage. Note that 4 submatrices appear inside the new stoichiometric matrix: The upper left submatrix is equivalent to the original stoichiometric matrix, the upper right submatrix has only zeros, the lower left submatrix has the kinetic information, and the lower right submatrix is the identity matrix.
- A
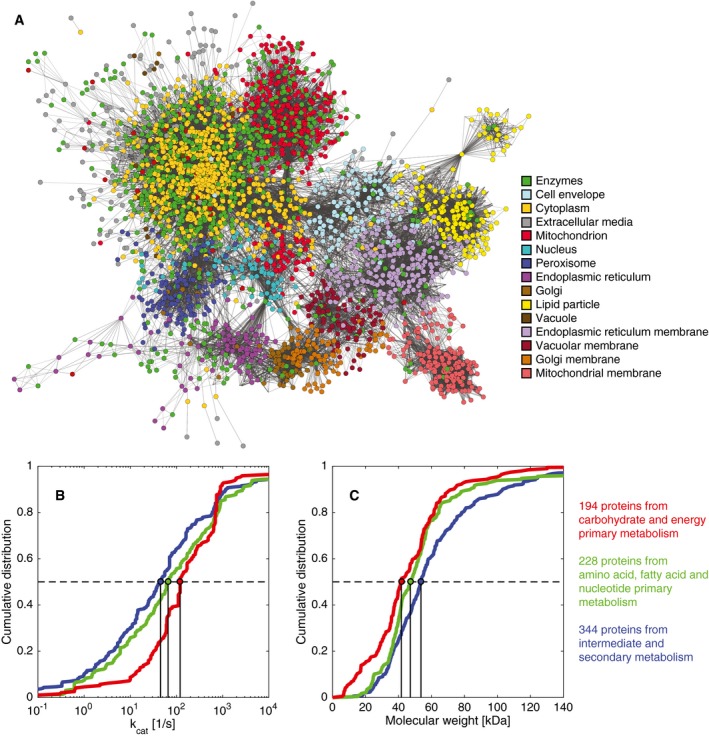
Network with metabolites and enzymes, color‐coded to show the location of enzymes (green dots) and metabolites (color‐coded by compartment).
- B, C
Cumulative distributions of (B) k cat values and (C) molecular weights for three different metabolic groups. All distributions were significantly different with P < 0.05 using a non‐parametric Wilcoxon rank‐sum test (Appendix Table S4).
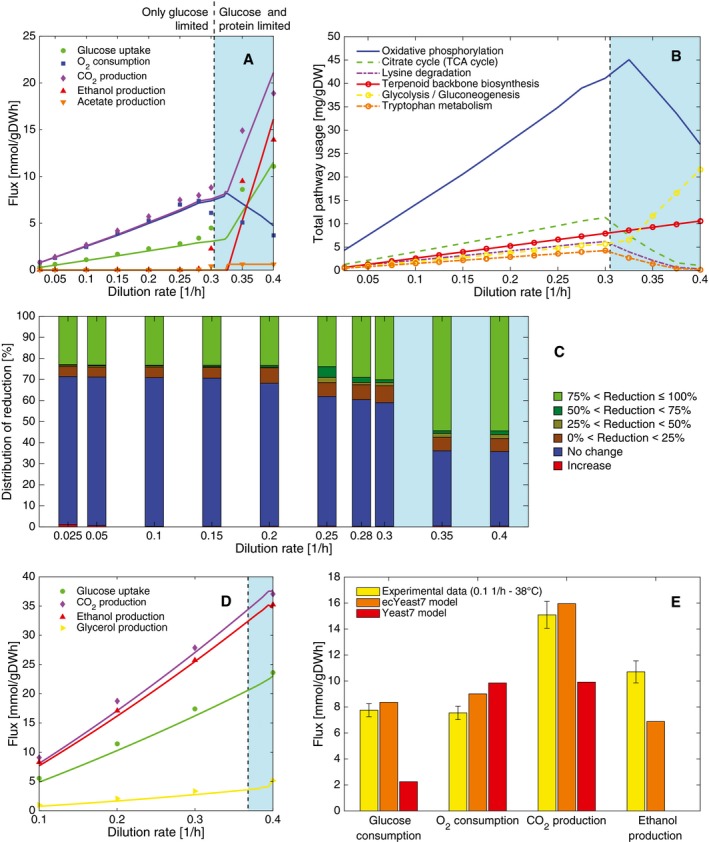
Chemostat aerobic data and model simulations at increasing dilution rate.
Predicted top 6 pathways used in terms of mass at increasing dilution rate in aerobic conditions.
Reduced flux variability compared with purely metabolic GEM simulations at increasing dilution rate in aerobic conditions.
Chemostat anaerobic data and model simulations at increasing dilution rate.
The model chooses to ferment when energy requirements for non‐growth maintenance are high. Experimental data (mean ± SD) were taken from biological triplicates of S. cerevisiae grown at high temperature (Lahtvee et al, 2016).
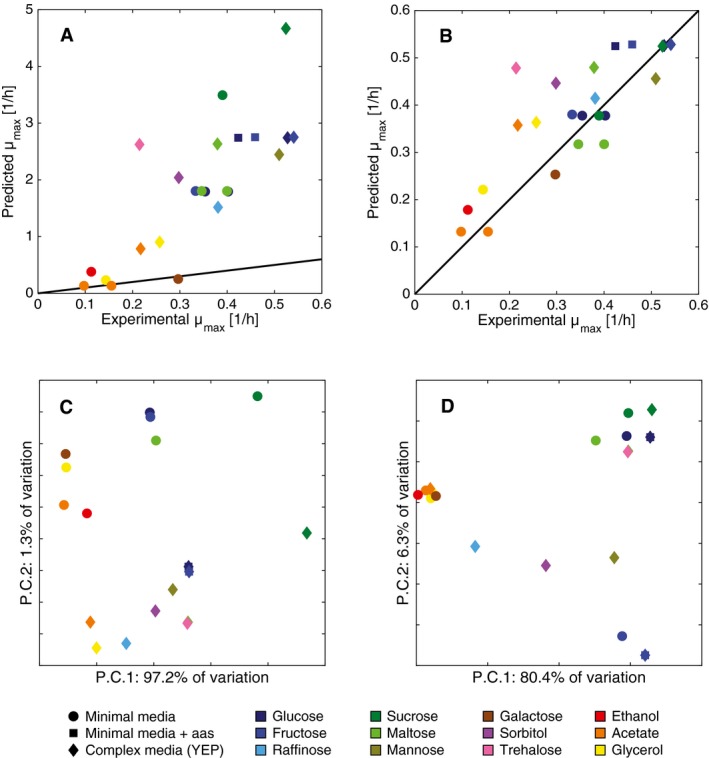
- A, B
Model simulations of maximum specific growth rate under different aerobic media conditions. (A) Yeast 7 simulations, with an average relative error of 100%. (B) ecYeast7 simulations, with an average relative error of 8%.
- C, D
First two components of a PCA for (C) Yeast7 and (D) ecYeast7 flux simulations.
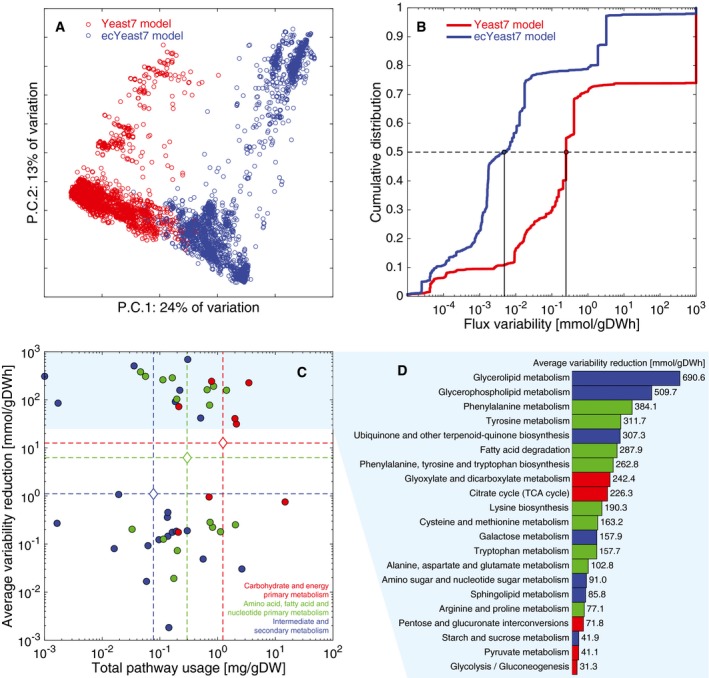
PCA of fluxes from 10,000 random simulations of Yeast7 and 10,000 random simulations of ecYeast7.
Flux variability for all non‐zero variable fluxes from Yeast7 (3,286 reactions, 66.1% of all reactions) and ecYeast7 (3,822 reactions, 56.7% of all reactions).
Distribution of different pathways in metabolism based on the total usage predicted by ecYeast7 (mg gDW−1) and their average flux variability reduction (mmol gDWh−1). The discontinuous lines indicate averages of the log values for different metabolic groups. The light blue filled region highlights the pathways with the highest average flux variability reduction shown in (D).
Breakdown of the pathways with the highest average flux variability reduction (mmol gDWh−1). Colors correspond to the metabolic groups indicated in (C).
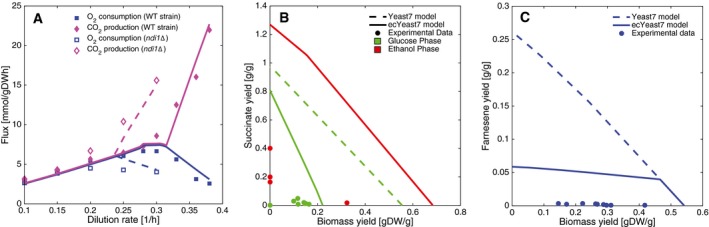
The physiological response of knocking out NDI1 can be reproduced using ecYeast7. Wild‐type and knockout experimental data are shown, together with model simulations (continuous and segmented lines, respectively).
Succinate yield (grams of succinate per grams of substrate) versus biomass yield (grams of dry weight biomass per grams of substrate) simulations under batch conditions, compared with experimental data. Both glucose and ethanol phases are shown.
Farnesene yield (grams of farnesene per grams of glucose) versus biomass yield (grams of dry weight biomass per grams of glucose) simulations under fed‐batch conditions, compared with experimental data.
References
-
- Bar‐Even A, Noor E, Savir Y, Liebermeister W, Davidi D, Tawfik DS, Milo R (2011) The moderately efficient enzyme: evolutionary and physicochemical trends shaping enzyme parameters. Biochemistry 50: 4402–4410 - PubMed
MeSH terms
LinkOut - more resources
Full Text Sources
Other Literature Sources
Molecular Biology Databases
Research Materials
