. 2017 Aug 4;7(1):7308.
doi: 10.1038/s41598-017-06504-5.

The Influence of Porosity on Fatigue Crack Initiation in Additively Manufactured Titanium Components

Affiliations

The Influence of Porosity on Fatigue Crack Initiation in Additively Manufactured Titanium Components

S Tammas-Williams et al. Sci Rep. .

Abstract

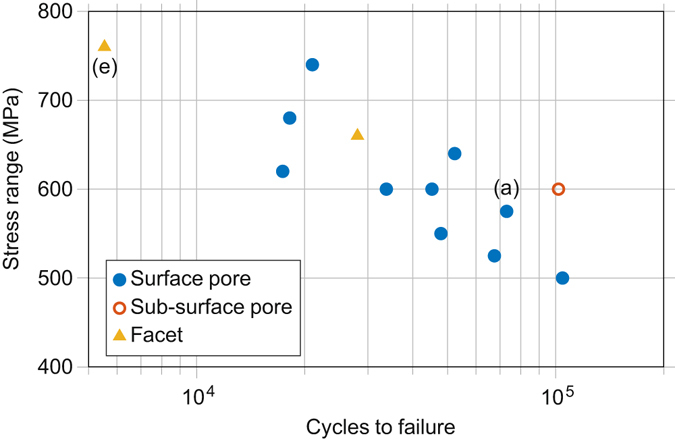
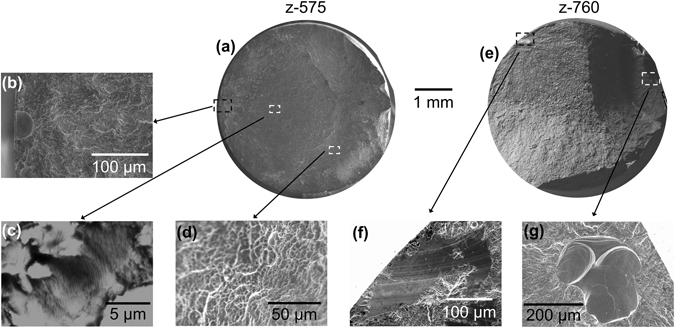
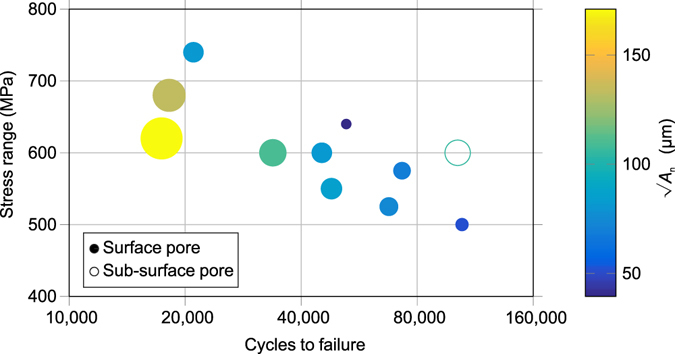
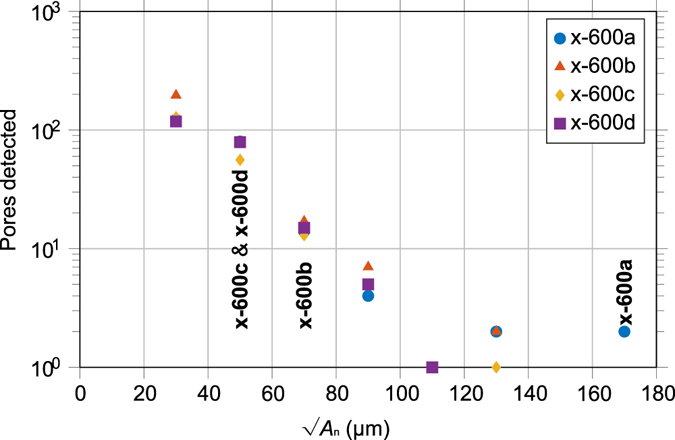
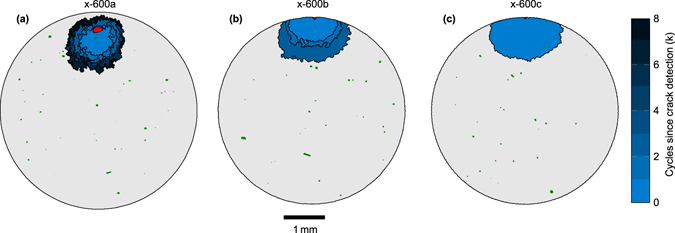
Without post-manufacture HIPing the fatigue life of electron beam melting (EBM) additively manufactured parts is currently dominated by the presence of porosity, exhibiting large amounts of scatter. Here we have shown that the size and location of these defects is crucial in determining the fatigue life of EBM Ti-6Al-4V samples. X-ray computed tomography has been used to characterise all the pores in fatigue samples prior to testing and to follow the initiation and growth of fatigue cracks. This shows that the initiation stage comprises a large fraction of life (>70%). In these samples the initiating defect was often some way from being the largest (merely within the top 35% of large defects). Using various ranking strategies including a range of parameters, we found that when the proximity to the surface and the pore aspect ratio were included the actual initiating defect was within the top 3% of defects ranked most harmful. This lays the basis for considering how the deposition parameters can be optimised to ensure that the distribution of pores is tailored to the distribution of applied stresses in additively manufactured parts to maximise the fatigue life for a given loading cycle.


Conflict of interest statement

The authors declare that they have no competing interests.

Figures

Figure 1
Figure 1
Measured fatigue life of EBM samples. – A S-N curve for uniaxial loading at R = 0 showing the number of fatigue cycles to failure against stress range for samples tested in the z-direction according to ASTM E466-07. Testing was conducted on cylindrical samples, with a gauge diameter and length of 4.5 mm and 12 mm, respectively, and a blend radius of 9 mm. The marker indicates the feature identified at the crack initiation location for each sample, while the letters enclosed in parentheses indicate the corresponding images in Fig. 2.
Figure 2
Figure 2
SEM images of example fracture surfaces - (a) macrograph of z-575, (b) crack initiation from a pore, (c) striations in the crack growth region, (d) SEM image of the fast fracture over-load region; (e) macrograph of z-760. (f) Crack initiation from a smooth facet, and (g) crack initiation from two conjoined gas pores.
Figure 3
Figure 3
Effect of pore size on fatigue life – S-N curve showing only those samples that failed from porosity for samples tested in the z-direction. The size and colour of the markers indicate the size of the pore (A n) measured from SEM images of the fracture surface.
Figure 4
Figure 4
Pore size distribution - Detected by CT in each of the four fatigue samples ~270 mm3 gauge volumes prior to testing in the x-direction (note log scale). The sample designations (bold) indicate the size of the crack initiating pore for the respective samples.
Figure 5
Figure 5
Fatigue crack initiation detected by CT. - Fatigue cracks (blue), the pore that initiated the crack (red), and all other pores (green) within a 1 mm thick slice centred around the plane of the crack, detected by CT after (a) 70 k, (b) 100 k and (c) 120 k cycles. In (a) and (b) multiple crack tidemarks show the detected crack size every 1 k cycles following first detection of the crack.
Figure 6
Figure 6
The stress concentration (K t) generated by a pores proximity to a free surface – The maximum increase in stress predicted by linear elastic FE modelling of pores at various depths (d) from the surface, normalised by the pore diameter (D) normal to the loading vector. Results are shown for idealised spheres/oblate spheroids with three different aspect ratios.
Figure 7
Figure 7
The stress concentration (K t) resulting from pores in close proximity to one another – The maximum increase in stress predicted by linear elastic FE modelling of two idealised spherical pores in close proximity. Loading is normal to the vector between pore centres. The separation (s), i.e. solid material, between pore edges has been normalised by the diameter (D 1) of one of the spheres. Results are shown for spheres of equal diameters (D 1 = D 2) and one sphere with twice the diameter of the other (2·D 1 = D 2).
Figure 8
Figure 8
Tensile stress (σ x) distribution within a homogenous fatigue test piece – The axisymmetric tensile stress predicted by linear elastic FE modelling in the x and r directions, where x and r are the distance from the sample centre, aligned with, and normal to, the axis of symmetry, respectively.
Figure 9
Figure 9
Fatigue crack initiation location in sample x-600a - Slices of the CT data in: (a) x-y plane and (b) x-z plane. Here, x is both the raking direction during the EBM build and loading direction during fatigue testing, while z is the build direction. Results of the analysis of the pore geometry detected by CT prior to testing with half the model visible, showing (c) tensile stress and (d) shear stress.
Figure 10
Figure 10
Distribution of porosity near the as-built surface of EBM components and its possible effect on fatigue life – (a) the size of pores identified on the fracture surface by SEM for samples against cycle to failure for samples tested at 600 MPa and failing from surface pores. (The standard deviation in measured pore size is contained within the marker size). (b) The total volume fraction of porosity with distance from the surface for standard and modified melt strategies (adapted from ref. 3). The number density of pores within one diameter of the surface when machining to different depths for a sample melted with (c) standard, and (d) slightly modified melt strategies. The probability of at least one pore with a size large enough to cause failure within a given number of cycles appearing near the machined surface for a (e) standard sample and (f) modified sample. In (e) and (f) the energy density (Ev) used to melt each area is given by the background colour.

References

    1. Frazier WE. Metal additive manufacturing: A review. J. Mater. Eng. Perform. 2014;23:1917–1928. doi: 10.1007/s11665-014-0958-z. - DOI
    1. Edwards P, O’Conner A, Ramulu M. Electron Beam Additive Manufacturing of Titanium Components: Properties and Performance. J. Manuf. Sci. Eng. 2013;135:61016-61016–7. doi: 10.1115/1.4025773. - DOI
    1. Tammas-Williams S, et al. XCT Analysis of the Influence of Melt Strategies on Defect Population in Ti-6Al-4V Components Manufactured by Selective Electron Beam Melting. Mater. Charact. 2015;102:47–61. doi: 10.1016/j.matchar.2015.02.008. - DOI
    1. Al-Bermani SS, Blackmore ML, Zhang W, Todd I. The origin of microstructural diversity, texture, and mechanical properties in electron beam melted Ti-6Al-4V. Metall. Mater. Trans. A Phys. Metall. Mater. Sci. 2010;41:3422–3434. doi: 10.1007/s11661-010-0397-x. - DOI
    1. Murr LE, et al. Microstructures and mechanical properties of electron beam-rapid manufactured Ti-6Al-4V biomedical prototypes compared to wrought Ti-6Al-4V. Mater. Charact. 2009;60:96–105. doi: 10.1016/j.matchar.2008.07.006. - DOI

Publication types