. 2017 Aug 4;7(1):7271.
doi: 10.1038/s41598-017-07400-8.

Defining a critical period for inhibitory circuits within the somatosensory cortex

Affiliations

Defining a critical period for inhibitory circuits within the somatosensory cortex

Shun Qiang Lo et al. Sci Rep. .

Abstract

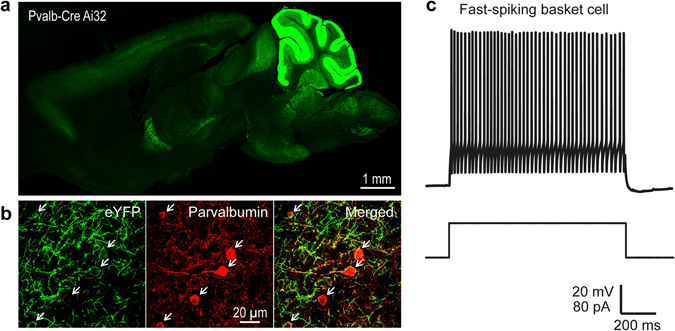
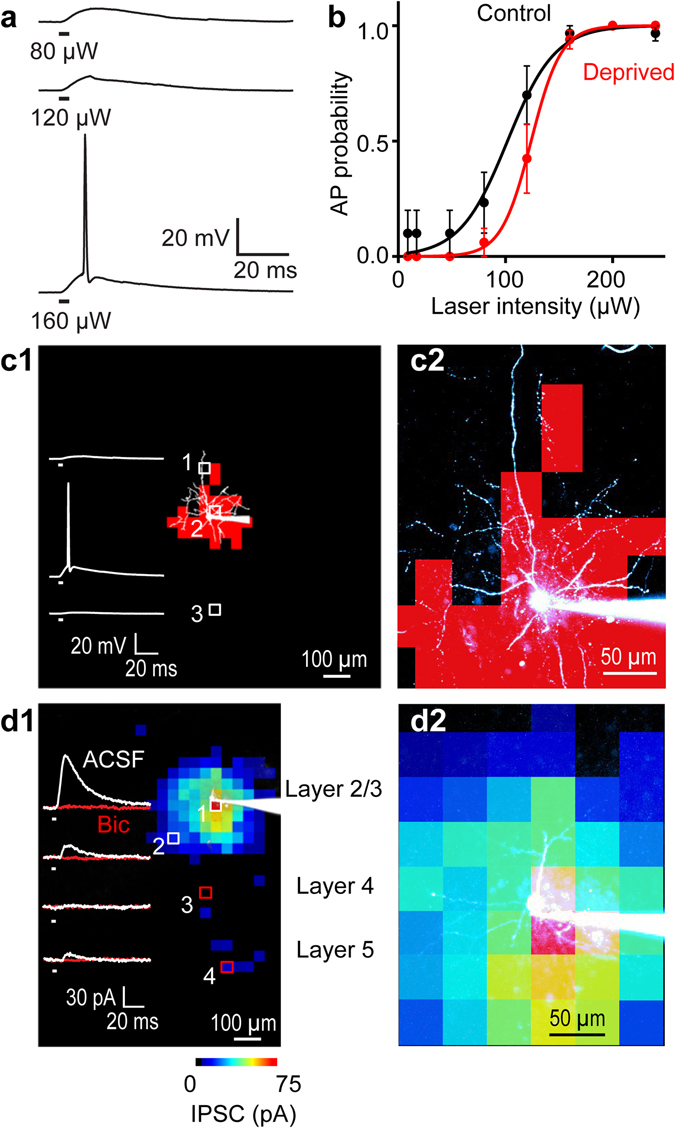
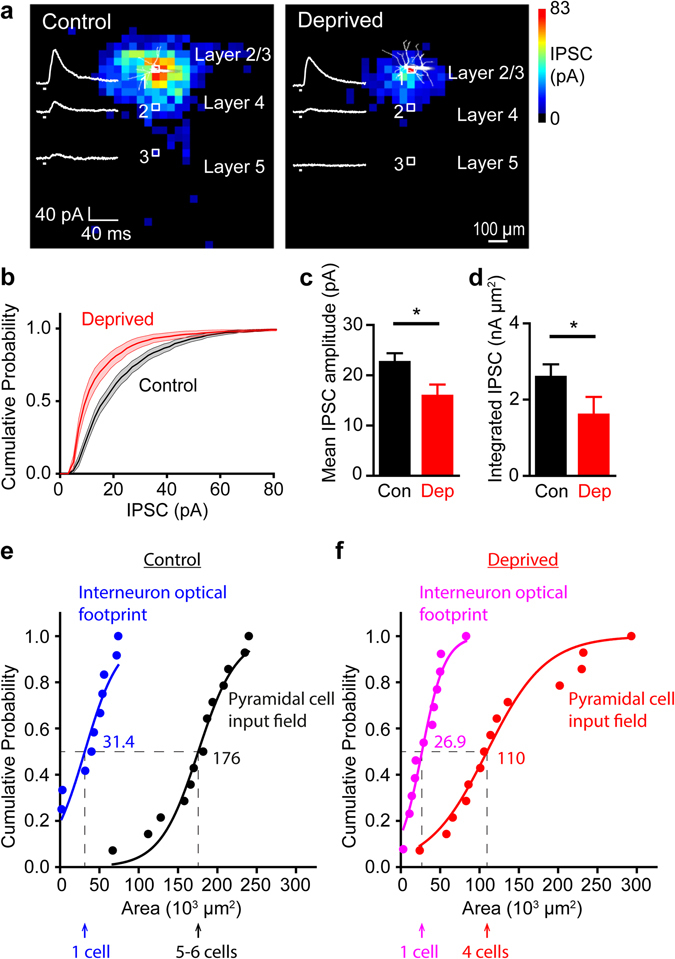
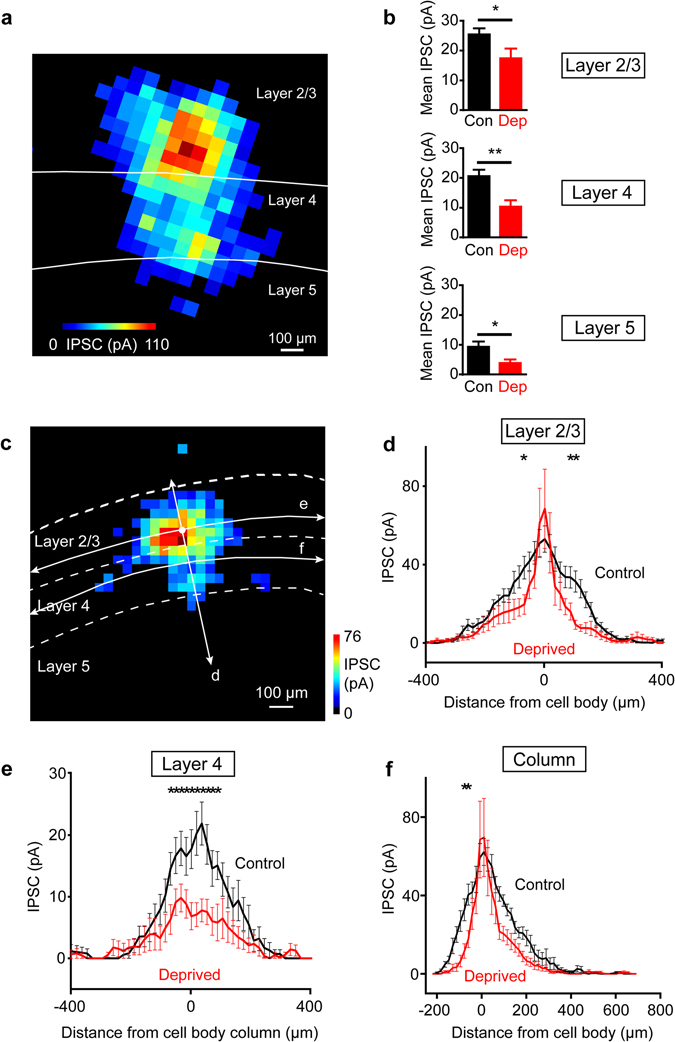
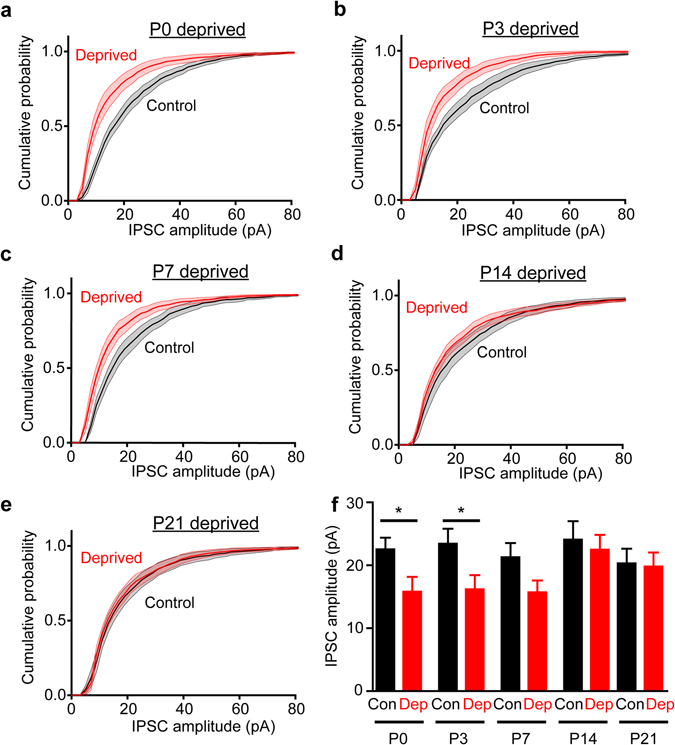
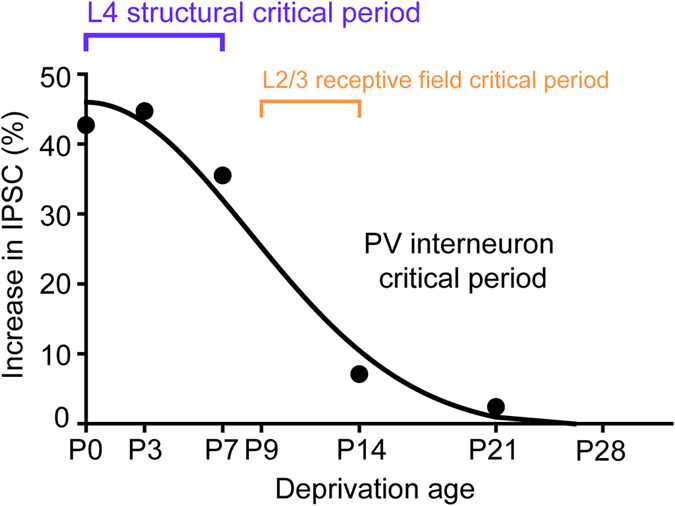
Although experience-dependent changes in brain inhibitory circuits are thought to play a key role during the "critical period" of brain development, the nature and timing of these changes are poorly understood. We examined the role of sensory experience in sculpting an inhibitory circuit in the primary somatosensory cortex (S1) of mice by using optogenetics to map the connections between parvalbumin (PV) expressing interneurons and layer 2/3 pyramidal cells. Unilateral whisker deprivation decreased the strength and spatial range of inhibitory input provided to pyramidal neurons by PV interneurons in layers 2/3, 4 and 5. By varying the time when sensory input was removed, we determined that the critical period closes around postnatal day 14. This yields the first precise time course of critical period plasticity for an inhibitory circuit.


Conflict of interest statement

The authors declare that they have no competing interests.

Figures

Figure 1
Figure 1
Expression of eYFP-tagged ChR2 in PV interneurons in the somatosensory cortex. (a) Expression of eYFP-tagged ChR2 (in green) in the cortex and cerebellum of double-transgenic Prv-Cre x Ai32 mice. (b) eYFP-tagged ChR2 (green) is expressed in PV interneurons (red) in the somatosensory cortex. (c) Action potential firing pattern (top trace) elicited in a fast-spiking basket cell in response to a 1 s duration depolarizing current pulse (lower trace).
Figure 2
Figure 2
Parvalbumin-expressing interneurons can be reliably photostimulated. (a) Responses elicited in a PV cell interneuron by somatic photostimulation at different light intensities. Duration of photostimulation indicated by black bars under traces. (b) A cumulative probability histogram showing that 160 µW laser power was sufficient to reliably photostimulate ChR2-expressing PV interneurons. Error bars represent s.e.m. (c1) Left – Spatially resolved photostimulation of a PV interneuron (shown in white image). Traces illustrate voltage responses to numbered locations in interneuron image. Light spots near the cell body elicited action potentials (2), but not in locations at the ends of the proximal dendrites (1) or in another layer (3). Red pixels in interneuron image indicate laser locations that evoked action potentials (optical footprint). (c2) Right - Magnified version of left image, more clearly showing the position of the PV interneuron in the optical footprint map. (d) Mapping of inhibitory inputs onto postsynaptic layer 2/3 pyramidal neurons, with current traces shown on the left. (d1) Left - Inhibitory responses (white traces) were blocked by bicuculline (red traces). Map of spatial distribution of IPSCs is superimposed on image of pyramidal neuron, with IPSC amplitude encoded in pseudocolor scale shown below. (d2) Right - Magnified version of map and pyramidal cell image shows the relationship of inhibitory inputs to the pyramidal neuron. Strongest IPSC responses were evoked near the pyramidal cell soma.
Figure 3
Figure 3
Chronic sensory deprivation decreased inhibitory transmission between PV interneurons and layer 2/3 pyramidal cells. (a) IPSC input maps of pyramidal cells in slices from control and deprived cortex from a mouse deprived at P0. Traces of illustrated IPSC responses recorded in response to numbered locations in layers 2/3, 4 and 5. (b) Cumulative probability distributions for IPSCs measured in response to PV interneuron photostimulation. IPSCs are smaller in deprived cortex (red). (c) Chronic deprivation decreased mean IPSC amplitudes (p = 0.016, Mann-Whitney two-tailed test, n = 14 cells each for deprived and controls, corresponding to 11 animals for deprived, 12 animals for controls). Error bars represent s.e.m. (d) Chronic deprivation decreased amplitude of integrated IPSC, measured as the sum of all IPSC responses above threshold. Treatment groups are significantly different (p = 0.019, Mann-Whitney two-tailed test, n = 14 cells each for deprived and controls, corresponding to 11 animals for deprived, 12 animals for controls). (e) Cumulative probability distributions for areas of optical footprint of control PV interneurons (blue) and IPSC input fields for control pyramidal neurons (black). The medians for the interneuron optical footprints and pyramidal cell IPSC input maps are indicated by dashed lines. Each data point represents a cell. (f) Cumulative probability distributions for areas of optical footprint of deprived PV interneurons (violet) and IPSC input fields for deprived pyramidal neurons (red). The medians for the interneuron optical footprints and pyramidal cell IPSC input maps are indicated by dashed lines. Each data point represents a cell.
Figure 4
Figure 4
Chronic sensory deprivation decreased IPSC amplitudes across layers. (a) IPSC input map for a pyramidal cell in a control slice showing IPSC inputs from layers 2/3, 4 and 5. Layer location was determined from DIC images of slices. (b) Mean IPSC amplitudes were decreased for deprived slices across layers 2/3, 4 and 5. Error bars represent s.e.m. (c) IPSC map showing a line scan of responses along layers 2/3 and 4 (horizontal white arrows) and also along the column (vertical white arrow), with the position of the cell indicated by a white dot. (d) Averaged line scan of responses from IPSC maps showing that chronic deprivation narrowed the range of IPSC responses along layer 2/3 with the cell body as the reference point. Error bars represent s.e.m. (n = 14 cells each for controls and deprived, corresponding to 12 animals for control and 11 animals for deprived). Two-way ANOVA was done for the line scan with Bonferroni post-hoc tests indicating a significant effect of deprivation on IPSC responses p < 0.0001. (e) Averaged line scan of responses from IPSC maps showing that chronic deprivation also decreased the amplitude of IPSC responses along layer 4 with increasing distance from the center, with the position of the cell body column as the reference point. Error bars represent s.e.m. (n = 14 cells each for controls and deprived, corresponding to 12 animals for control and 11 animals for deprived). Two-way ANOVA was done for the line scan with Bonferroni post-hoc tests indicating a significant effect of deprivation on IPSC responses p < 0.0001. (f) Averaged line scan of responses from IPSC maps showing that chronic deprivation also decreased the amplitude of IPSC responses along the column with increasing distance from the center, with the position of the cell body as the reference point. Error bars represent s.e.m. (n = 14 cells each for controls and deprived, corresponding to 12 animals for control and 11 animals for deprived). Two-way ANOVA was done for the line scan with Bonferroni post-hoc tests indicating a significant effect of deprivation on IPSC responses p < 0.0001.
Figure 5
Figure 5
The sensitivity of PV interneuron-mediated IPSCs to whisker deprivation decreases with developmental age. (a)–(e) Averaged probability cumulative distributions of IPSCs for deprived slices converged with controls at P14 and P21 deprivation. (f) Mean inhibition in deprived slices was decreased significantly with deprivation starting at P0 (p = 0.016) and P3 (p = 0.032), and recovered to similar levels to controls when the deprivation date was delayed to P7, P14 and P21 (p = 0.073 at P7, 0.48 at P14, and 0.80 at P21 respectively; Mann-Whitney two-tailed test comparing only within each timepoint group independently, n numbers of P0: 14 cells each for controls and deprived, corresponding to 12 animals for controls, 11 animals for deprived, P3: 9 cells each for controls and deprived, corresponding to 6 animals each for controls and deprived, P7: 9 cells controls and 14 cells deprived, corresponding to 8 animals for controls, 12 animals for deprived, P14: 8 cells controls and 11 cells deprived, corresponding to 5 animals for control, 7 animals for deprived, P21: 12 cells each for controls and deprived, corresponding to 9 animals for control, 7 animals for deprived). Error bars represent s.e.m.
Figure 6
Figure 6
A critical period for experience-dependent plasticity in the inhibitory circuit. Curve depicts differences in mean IPSCs measured between control and deprived slices at different times of starting whisker deprivation. Sensory experience increases IPSCs in controls relative to deprived slices. The largest experience-dependent changes in IPSCs occurred at P0 and P7, decreasing sharply at P14 and P21 time points. Curve is a half-Gaussian fit with a half-width of approximately 10 days (R2 = 0.95). Critical periods observed in layers 2/3 and 4 in the somatosensory cortex. The layer 2/3 receptive field critical period (yellow) was assembled from observations reported previously. The layer 4 critical period (blue) illustrates the relationship between layer 4 barrel size and deprivation start date.

Similar articles

Cited by

References

    1. Jeanmonod D, Rice FL, Van der Loos H. Mouse somatosensory cortex: alterations in the barrelfield following receptor injury at different early postnatal ages. Neuroscience. 1981;6:1503–1535. doi: 10.1016/0306-4522(81)90222-0. - DOI - PubMed
    1. Fagiolini M, Jensen CL, Champagne FA. Epigenetic influences on brain development and plasticity. Curr Opin Neurobiol. 2009;19:207–212. doi: 10.1016/j.conb.2009.05.009. - DOI - PMC - PubMed
    1. Sweatt JD. Experience-dependent epigenetic modifications in the central nervous system. Biol Psychiatry. 2009;65:191–197. doi: 10.1016/j.biopsych.2008.09.002. - DOI - PMC - PubMed
    1. Wiesel TN, Hubel DH. Effects of visual deprivation on morphology and physiology of cells in the cats lateral geniculate body. J Neurophysiol. 1963;26:978–993. - PubMed
    1. Wiesel TN, Hubel DH. Single-cell responses in striate cortex of kittens deprived of vision in one eye. J Neurophysiol. 1963;26:1003–1017. - PubMed

Publication types

LinkOut - more resources