. 2017 Aug 4;7(1):7306.
doi: 10.1038/s41598-017-07767-8.

Robust circadian clock oscillation and osmotic rhythms in inner medulla reflecting cortico-medullary osmotic gradient rhythm in rodent kidney

Affiliations

Robust circadian clock oscillation and osmotic rhythms in inner medulla reflecting cortico-medullary osmotic gradient rhythm in rodent kidney

Masayuki Hara et al. Sci Rep. .

Abstract

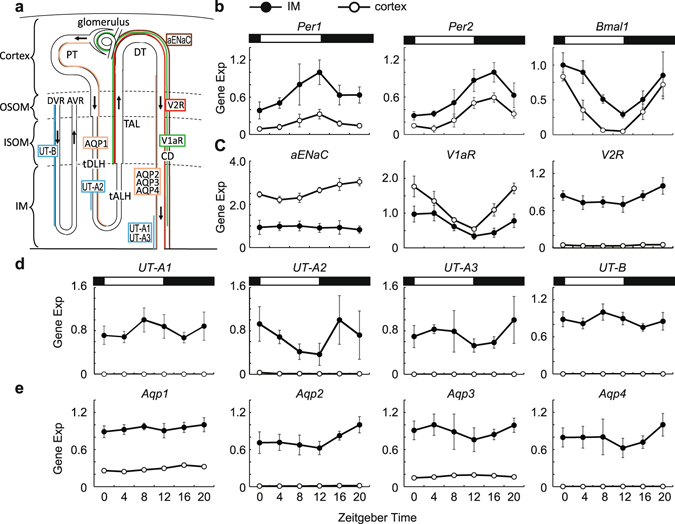
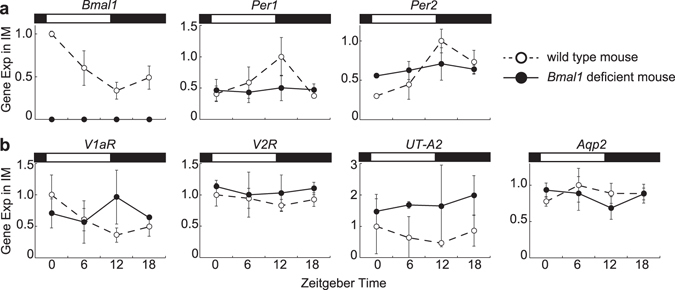
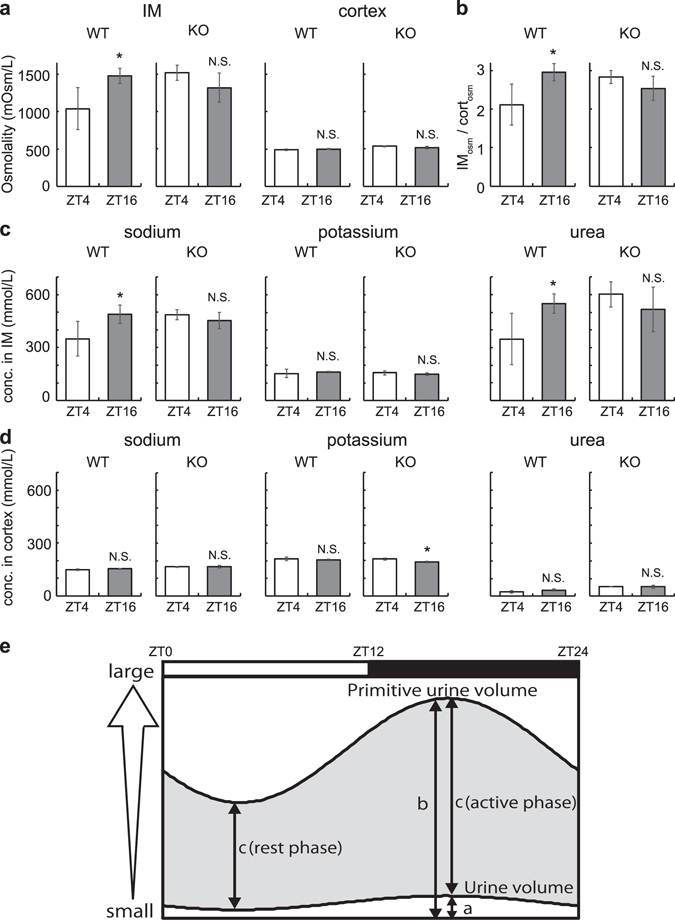
Circadian clocks in mammals function in most organs and tissues throughout the body. Various renal functions such as the glomerular filtration and excretion of electrolytes exhibit circadian rhythms. Although it has been reported that the expression of the clock genes composing molecular oscillators show apparent daily rhythms in rodent kidneys, functional variations of regional clocks are not yet fully understood. In this study, using macroscopic bioluminescence imaging method of the PER2::Luciferase knock-in mouse kidney, we reveal that strong and robust circadian clock oscillation is observed in the medulla. In addition, the osmotic pressure in the inner medulla shows apparent daily fluctuation, but not in the cortex. Quantitative-PCR analysis of the genes contributing to the generation of high osmotic pressure or the water re-absorption in the inner medulla, such as vasopressin receptors (V1aR, V2R), urea transporter (UT-A2) and water channel (Aqp2) show diurnal variations as well as clock genes. Deficiency of an essential clock gene Bmal1 impairs day-night variations of osmotic pressure gradient in the inner medulla, suggesting that circadian clocks in the medulla part of the kidney may regulate the circadian rhythm of cortico-medullary osmotic pressure gradient, and may contribute physiological day-night rhythm of urination.


Conflict of interest statement

The authors declare that they have no competing interests.

Figures

Figure 1
Figure 1
Localization of PER2::Luc activity in kidney. (a) Anatomical structure of mouse kidney. (b) PER2::Luc activity in slice cultured kidney. A bright field image (left) and a luminescence image (right) are displayed. White horizontal bar indicates 3 mm. (c) Time series observation of the bioluminescence in a slice cultured kidney. We set 0hr when we started observations. (d,e) Quantitative analysis of regions of interest (ROIs) in the kidney slice. Set ROIs are shown in (d). Circadian rhythmic signal intensities were observed in the cortex, OM, and IM (e). OM, outer medulla; IM, inner medulla; OSOM, Outer stripe of outer medulla; ISOM, Inner stripe of outer medulla.
Figure 2
Figure 2
Diurnal variations of electrolytes, urea concentrations, and osmotic pressure in rat kidney. (a–b) Diurnal variations of electrolytes and urea concentrations in the IM (a) and cortex (b). From left to right, diurnal variations of sodium, potassium, chloride, and urea concentrations are shown. (c) Osmotic pressure in the IM (left) and cortex of the rat kidney (right). (d) IM-cortex osmotic pressure ratio (IMosm/cortosm) representing osmotic pressure gradient. Mean values ± standard deviations (S.D.) (n = 4). White and black rectangles in graphs indicate the light phase and the dark phase, respectively.
Figure 3
Figure 3
Clock genes and genes contributing high osmotic pressure gradient and water re-absorption in mouse kidney. (a) Diagrammatic representation of the localization of analized genes in the long-looped nephron and vasa recta. Aqp1 is expressed in proximal tubules (PT) and thin descending limbs of Henle’s loop (tDLH) (orange). Aqp2, Aqp3, and Aqp4 are expressed in the collecting ducts (CD) (orange). V1aR is expressed the thick ascending limbs (TAL) of Henle’s loop, distal tubule (DT), and the CD except for deeper third of the inner medullary CD, and glomerulus (green). V2R is expressed in the TAL, DT, and the CD (red). UT-A1 and UT-A3 are expressed in the deepest part of the inner medullary CD (blue). UT-A2 is expressed in a limited portion of tDLH (blue). UT-B is expressed in the descending vasa recta (DVR) throughout the medulla (blue). aENaC is expressed the DT and the CD (brown). The other abbreviations used are: OSOM, Outer stripe of outer medulla; ISOM, Inner stripe of outer medulla; IM, Inner medulla; AVR, ascending vasa recta; tALH, thin ascending limb of Henle. (be) Diurnal variations of Per1, Per2, Bmal1 (b), aEnac, vasopressin receptors (c), urea transporters (d), and water channels (e). Each gene expressions in the IM (•) and cortex (⚬) are shown. Data were normalized to 18S ribosomal RNA (mean values ± S.D, n = 6). White and black rectangles in graphs indicate the light phase and the dark phase, respectively.
Figure 4
Figure 4
Diurnal variations of clock gene expressions (a) and diurnal variation of UT-A2, Aqp2, V1aR, and V2R (b) in the IM. Data obtained from Bmal1 deficient mouse () and age matched wild type mouse (◦) are shown. Data were normalized to 18S ribosomal RNA (mean values ± S.D, n = 3). White and black rectangles in graphs indicate light phase and dark phase, respectively.
Figure 5
Figure 5
Day-night variations of osmotic pressure, electrolytes, and urea concentrations in wild type and Bmal1 deficient mouse kidney. (a) Osmotic pressure in the IM (left) and cortex of the mouse kidney (right). (b) IM-cortex osmotic pressure ratio (IMosm/cortosm) representing osmotic pressure gradient. (c,d) Day-night difference of electrolytes and urea concentrations in the IM (c) and cortex (d). From left to right, day-night difference of sodium, potassium, chloride, and urea concentrations are shown. We used pooled IM and cortex samples from three mice as one sample for measurement and performed four independent experiments. Values are shown as mean values ± S.D. *p < 0.05 versus ZT4. N.S., not significant. (e) Schematic view of primitive urine volume and urine volume. a and b denotes urine volume and primitive urine volume, respectively. c denotes water re-absorption volume that equals to difference between primitive urine volume and urine volume (gray shade). Both a and GFR (reflecting in b) are larger at night. As b is nearly a hundred-times larger than a , circadian variation of b is mainly reflected in the circadian variation of c. Therefore, (c) (active phase) is higher than c (rest phase). White and black rectangles in schema indicate the light phase and the dark phase, respectively.

References

    1. Lowrey PL, Takahashi JS. Genetics of circadian rhythms in Mammalian model organisms. Advances in genetics. 2011;74:175–230. - PMC - PubMed
    1. Bass J. Circadian topology of metabolism. Nature. 2012;491:348–356. doi: 10.1038/nature11704. - DOI - PubMed
    1. Masri S, Zocchi L, Katada S, Mora E, Sassone-Corsi P. The circadian clock transcriptional complex: metabolic feedback intersects with epigenetic control. Annals of the New York Academy of Sciences. 2012;1264:103–109. doi: 10.1111/j.1749-6632.2012.06649.x. - DOI - PMC - PubMed
    1. Firsov D, Bonny O. Circadian regulation of renal function. Kidney international. 2010;78:640–645. doi: 10.1038/ki.2010.227. - DOI - PubMed
    1. Hastings MH, Reddy AB, Maywood ES. A clockwork web: circadian timing in brain and periphery, in health and disease. Nat Rev Neurosci. 2003;4:649–661. doi: 10.1038/nrn1177. - DOI - PubMed

Publication types

LinkOut - more resources