. 2017 Aug 4;7(1):7364.
doi: 10.1038/s41598-017-07480-6.

Seabird distribution patterns observed with fishing vessel's radar reveal previously undescribed sub-meso-scale clusters

Affiliations

Seabird distribution patterns observed with fishing vessel's radar reveal previously undescribed sub-meso-scale clusters

Camille Assali et al. Sci Rep. .

Abstract

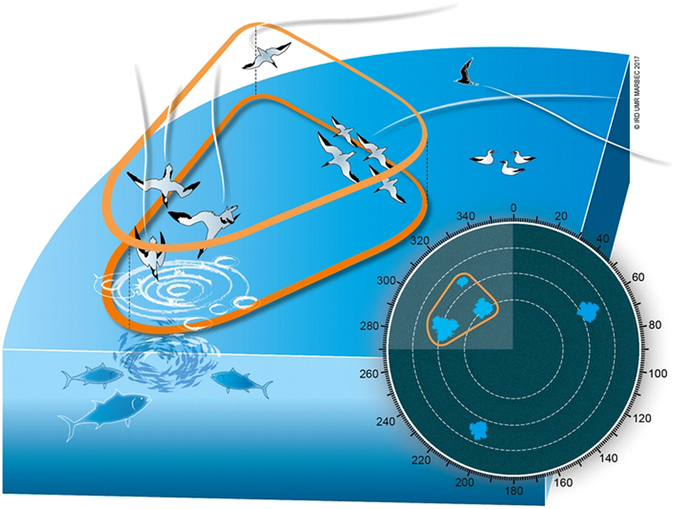
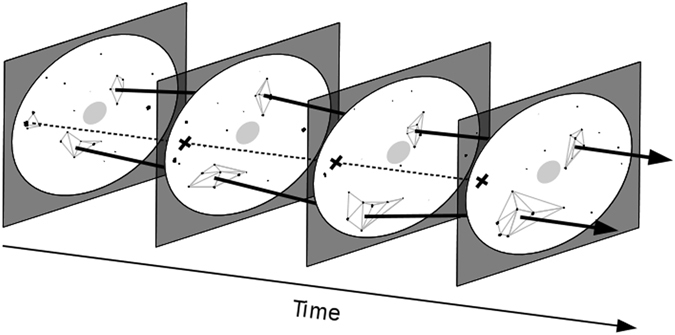
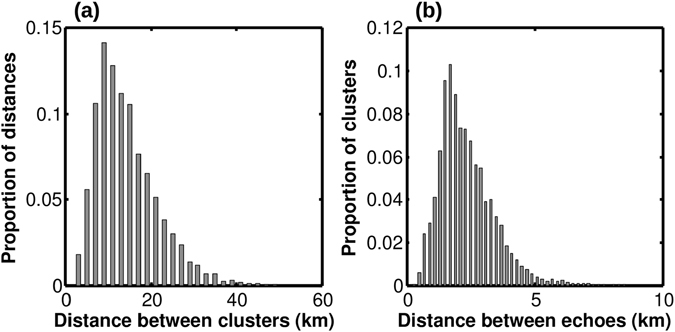
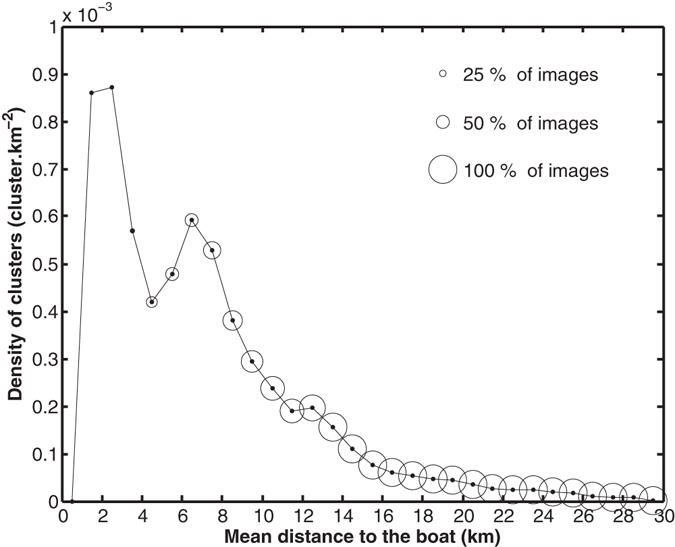
Seabirds are known to concentrate on prey patches or at predators aggregations standing for potential feeding opportunities. They may search for prey using olfaction or by detecting visually feeding con-specifics and sub-surface predators, or even boats. Thus, they might form a foraging network. We hypothesized that conditionally to the existence of a foraging network, the visual detection ability of seabirds should have a bearing on their medium-scale distribution at sea. Using a fishing-boat radar to catch the instantaneous distribution of seabirds groups within 30 km around the vessel, we conducted a spatial clustering of the seabird-echoes. We found 7,657 clusters (i.e. aggregations of echoes), lasting less than 15 minutes and measuring 9.2 km in maximum length (median). Distances between seabirds groups within clusters showed little variation (median: 2.1 km; CV: 0.5), while area varied largely (median: 21.9 km2; CV: 0.8). Given existing data on seabirds' reaction distances to boats or other marine predators, we suggest that these structures may represent active foraging sequences of seabirds spreading themselves in space such as to possibly cue on each others. These seabird clusters were not previously described and are size compatible with the existence of a foraging network.


Conflict of interest statement

The authors declare that they have no competing interests.

Figures

Figure 1
Figure 1
This illustration depicts an hypothetical oceanic scene with different seabirds and its possible appearance in the radar screen. The information relevant to this work are: (1) echoes in the radar can be either one bird or a group of birds foraging or transiting (referred to as “seabird-echoes” or “seabirds groups” in the text); (2) small seabirds and seabirds sitting on the water are unlikely to be detected by the radar; (3) when echoes are spaced such that they appear close together (see how in methods), they form a cluster of echoes (referred to as such in the text). Clusters might then be considered as “groups of seabirds groups”.
Figure 2
Figure 2
This illustration depicts the tracking procedure of clusters’ centroids. The four panels correspond to four successive schematised radar images. In each image, white circle represents the scanned radar disk, black dots are seabird-echoes, and the central light grey circle symbolises the central saturated zone where no information is available. Black arrows crossing radar disks link clusters of echoes showing spatial and temporal consistency. Dotted line and black crosses stand for missing linkages of a cluster’s centroid in three successive images, thus closing the tracking procedure for this cluster. The latter is invalidate by the tracking procedure and considered as a non-consistent structure in seabirds distribution.
Figure 3
Figure 3
(a) Distribution of distances between synchronous clusters’ centroids (km). (b) Distribution of the mean distance between echoes within clusters (km).
Figure 4
Figure 4
Density of clusters (cluster.km−2) as a function of the distance to the boat (km). Each cluster is located at its mean position. Circles indicate the proportion of images contributing to the estimates; this proportion is lesser at small distances due to numerous images with saturated and unexploited zone in the first kilometres from the boat.

Similar articles

Cited by

References

    1. Paiva VH, Geraldes P, Ramírez I, Garthe S, Ramos JA. How area restricted search of a pelagic seabird changes while performing a dual foraging strategy. Oikos. 2010;119:1423–1434. doi: 10.1111/j.1600-0706.2010.18294.x. - DOI
    1. Humphries NE, Weimerskirch H, Queiroz N, Southall EJ, Sims DW. Foraging success of biological Lévy flights recorded in situ. Proc. Natl. Acad. Sci. 2012;109:7169–7174. doi: 10.1073/pnas.1121201109. - DOI - PMC - PubMed
    1. Götmark F, Winkler DW, Andersson M. Flock-feeding on fish schools increases individual success in gulls. Nature. 1986;319:589–591. doi: 10.1038/319589a0. - DOI - PubMed
    1. Lett C, Semeria M, Thiebault A, Tremblay Y. Effects of successive predator attacks on prey aggregations. Theor. Ecol. 2014;7:239–252. doi: 10.1007/s12080-014-0213-0. - DOI - PubMed
    1. Thiebault A, Semeria M, Lett C, Tremblay Y. How to capture fish in a school? Effect of successive predator attacks on seabird feeding success. J. Anim. Ecol. 2016;85:157–167. doi: 10.1111/1365-2656.12455. - DOI - PubMed

LinkOut - more resources