

The Effects of GLCM parameters on LAI estimation using texture values from Quickbird Satellite Imagery
- PMID: 28779107
- PMCID: PMC5544764
- DOI: 10.1038/s41598-017-07951-w
The Effects of GLCM parameters on LAI estimation using texture values from Quickbird Satellite Imagery
Abstract
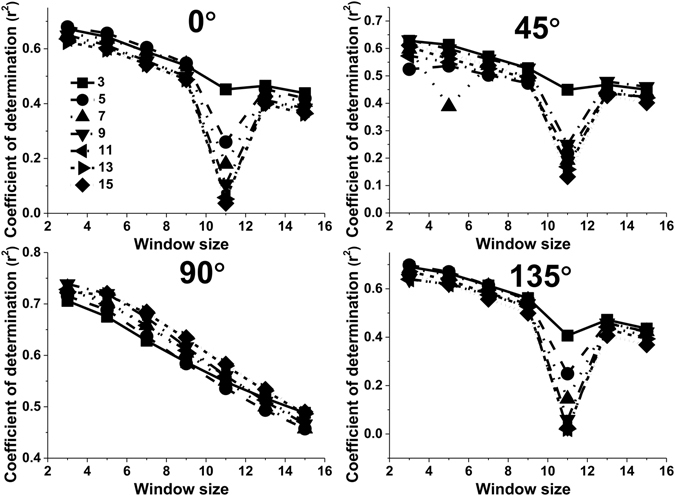
When the leaf area index (LAI) of a forest reaches 3, the problem of spectrum saturation becomes the main limitation to improving the accuracy of the LAI estimate. A sensitivity analysis of the Grey Level Co-occurrence Matrix (GLCM) parameters which can be applied to satellite image processing and analysis showed that the most important parameters included orientation, displacement and moving window size. We calculated the values of Angular Second Moment (ASM), Entropy (ENT), Correlation (COR), Contrast (CON), Dissimilarity (DIS) and Homogeneity (HOM) from Quickbird panchromatic imagery using a GLCM method. Four orientations, seven displacements and seven window sizes were considered. An orientation of 90° was best for estimating the LAI of black locust forest, regardless of moving window size, displacement and texture parameters. Displacements of 3 pixels appeared to be best. The orientation and window size had only a little influence on these settings. The highest adjusted r2 values were obtained using a 3 × 3 moving window size for ASM and ENT. The tendency of CON, COR, DIS and HOM to vary with window size was significantly affected by orientation. This study can help with parameter selection when texture features from high resolution imagery are used to estimate broad-leaved forest structure information.
Conflict of interest statement
The authors declare that they have no competing interests.
Figures


Similar articles
-
Optimizing window size and directional parameters of GLCM texture features for estimating rice AGB based on UAVs multispectral imagery.Front Plant Sci. 2023 Dec 19;14:1284235. doi: 10.3389/fpls.2023.1284235. eCollection 2023. Front Plant Sci. 2023. PMID: 38192693 Free PMC article.
-
[Estimating leaf area index of black locust (Robinia pseudoacacia L.) plantations based on texture parameters of quickbird imagery].Ying Yong Sheng Tai Xue Bao. 2014 May;25(5):1266-74. Ying Yong Sheng Tai Xue Bao. 2014. PMID: 25129924 Chinese.
-
In vivo skin capacitive imaging analysis by using grey level co-occurrence matrix (GLCM).Int J Pharm. 2014 Jan 2;460(1-2):28-32. doi: 10.1016/j.ijpharm.2013.10.024. Epub 2013 Nov 2. Int J Pharm. 2014. PMID: 24188984
-
Quantitative Response of Gray-Level Co-Occurrence Matrix Texture Features to the Salinity of Cracked Soda Saline-Alkali Soil.Int J Environ Res Public Health. 2022 May 27;19(11):6556. doi: 10.3390/ijerph19116556. Int J Environ Res Public Health. 2022. PMID: 35682139 Free PMC article.
-
Estimation of Tree Size Diversity Using Object Oriented Texture Analysis and Aster Imagery.Sensors (Basel). 2008 Aug 11;8(8):4709-4724. doi: 10.3390/s8084709. Sensors (Basel). 2008. PMID: 27873781 Free PMC article.
Cited by
-
Research on the visual image-based complexity perception method of autonomous navigation scenes for unmanned surface vehicles.Sci Rep. 2022 Jun 20;12(1):10370. doi: 10.1038/s41598-022-14355-y. Sci Rep. 2022. PMID: 35726003 Free PMC article.
-
High-Precision Detection of Defects of Tire Texture Through X-ray Imaging Based on Local Inverse Difference Moment Features.Sensors (Basel). 2018 Aug 2;18(8):2524. doi: 10.3390/s18082524. Sensors (Basel). 2018. PMID: 30072636 Free PMC article.
-
Remote sensing of savanna woody species diversity: A systematic review of data types and assessment methods.PLoS One. 2022 Dec 1;17(12):e0278529. doi: 10.1371/journal.pone.0278529. eCollection 2022. PLoS One. 2022. PMID: 36455048 Free PMC article.
-
Estimating leaf area index using unmanned aerial vehicle data: shallow vs. deep machine learning algorithms.Plant Physiol. 2021 Nov 3;187(3):1551-1576. doi: 10.1093/plphys/kiab322. Plant Physiol. 2021. PMID: 34618054 Free PMC article.
-
Optimizing window size and directional parameters of GLCM texture features for estimating rice AGB based on UAVs multispectral imagery.Front Plant Sci. 2023 Dec 19;14:1284235. doi: 10.3389/fpls.2023.1284235. eCollection 2023. Front Plant Sci. 2023. PMID: 38192693 Free PMC article.
References
-
- Pope G, Treitz P. leaf area index (lai) estimation in boreal mixedwood forest of Ontario, Canada using light detection and ranging (LiDAR) and WorldView-2 imagery. Remote Sens. 2013;5:5040–5063. doi: 10.3390/rs5105040. - DOI
-
- Rautiainen M, Heiskanen J, Korhonen L. Seasonal changes in canopy leaf area index and moDis vegetation products for a boreal forest site in central Finland. Boreal Environ. Res. 2012;17:72–84.
-
- Zhou JJ, et al. A comparison of three methods for estimating the LAI of black locust Robinia pseudoacacia L. plantations on the Loess Plateau, China. Int. J. Remote. Sens. 2014;35:171–188. doi: 10.1080/01431161.2013.866289. - DOI
-
- Riaño D, Valladares F, Condés S, Chuvieco E. Estimation of leaf area index and covered ground from airborne laser scanner (Lidar) in two contrasting forests. Agr. Forest Meteorol. 2004;124:269–275. doi: 10.1016/j.agrformet.2004.02.005. - DOI
-
- Thomas V, Noland T, Treitz P, McCaughey JH. Leaf area and clumping indices for a boreal mixed-wood forest: lidar, hyperspectral, and Landsat models. Int. J. Remote. Sens. 2011;32:8271–8297. doi: 10.1080/01431161.2010.533211. - DOI
Publication types
LinkOut - more resources
Full Text Sources
Other Literature Sources
Research Materials
Miscellaneous
