. 2017 Aug 4;7(1):7329.
doi: 10.1038/s41598-017-07637-3.

Excessive alcohol consumption induces methane production in humans and rats

Affiliations

Excessive alcohol consumption induces methane production in humans and rats

E Tuboly et al. Sci Rep. .

Abstract

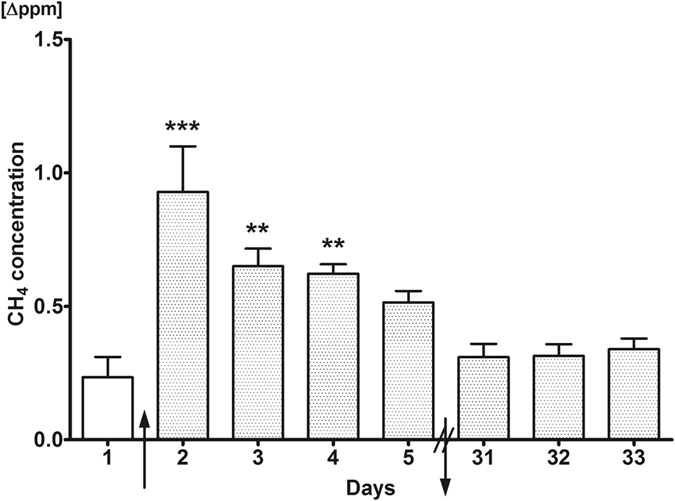
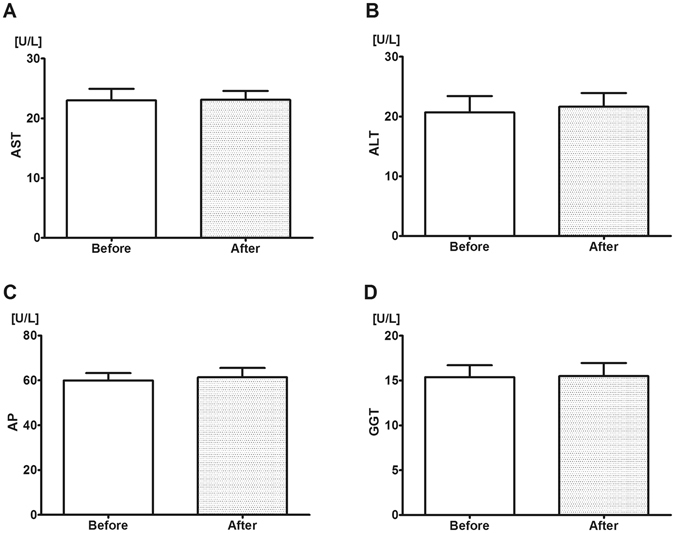
Various studies have established the possibility of non-bacterial methane (CH4) generation in oxido-reductive stress conditions in plants and animals. Increased ethanol input is leading to oxido-reductive imbalance in eukaryotes, thus our aim was to provide evidence for the possibility of ethanol-induced methanogenesis in non-CH4 producer humans, and to corroborate the in vivo relevance of this pathway in rodents. Healthy volunteers consumed 1.15 g/kg/day alcohol for 4 days and the amount of exhaled CH4 was recorded by high sensitivity photoacoustic spectroscopy. Additionally, Sprague-Dawley rats were allocated into control, 1.15 g/kg/day and 2.7 g/kg/day ethanol-consuming groups to detect the whole-body CH4 emissions and mitochondrial functions in liver and hippocampus samples with high-resolution respirometry. Mitochondria-targeted L-alpha-glycerylphosphorylcholine (GPC) can increase tolerance to liver injury, thus the effects of GPC supplementations were tested in further ethanol-fed groups. Alcohol consumption was accompanied by significant CH4 emissions in both human and rat series of experiments. 2.7 g/kg/day ethanol feeding reduced the oxidative phosphorylation capacity of rat liver mitochondria, while GPC significantly decreased the alcohol-induced CH4 formation and hepatic mitochondrial dysfunction as well. These data demonstrate a potential for ethanol to influence human methanogenesis, and suggest a biomarker role for exhaled CH4 in association with mitochondrial dysfunction.


Conflict of interest statement

The authors declare that they have no competing interests.

Figures

Figure 1
Figure 1
Exhaled CH4 production profile of humans during the course of the study. Exhaled CH4 production on days 1–5 and 31–33 of the investigation is depicted. During the first measurement on day 1, all volunteers were untreated. Alcohol consumption induced significant CH4 production by the 2nd day compared to the 1st day, and this level decreased remarkably by the 5th day. Mean values and standard error of mean (SEM) are given; **p < 0.01 and ***p < 0.001 vs. day 1. The arrows pointing upwards and downwards represent start and end of alcohol intake, respectively. Statistics: one-way ANOVA with Dunnett’s multiple comparison test.
Figure 2
Figure 2
Liver-specific enzyme levels before and after alcohol consumption in humans. Enzyme levels were determined in plasma from blood samples taken on days 1 (control, left boxes) and 5 (last day of alcohol consumption, right boxes) of the investigation. During the first measurement, all volunteers were untreated. (A) Aspartate aminotransferase (AST), (B) Alanine aminotransferase (ALT), (C) Alkaline phosphatase (AP) and (D) Gamma glutamyl transferase (GGT) levels. Alcohol consumption did not alter enzyme levels. Mean values and standard error of mean (SEM) are given; p < 0.05 vs. day 1 (control). Statistics: Paired-test.
Figure 3
Figure 3
Whole-body CH4 release of rats. Whole body CH4 production was measured on days 1, 3, 5, and 8 of the investigation. Ethanol feeding induced significant CH4 production by the 3rd day in the 1.15 g/kg/day alcohol-treated group and by the 5th day in the 2.7 g/kg/day alcohol-treated group, compared to control group. However, in the GPC-treated groups no increase was observed as compared to controls. Empty circles with continuous line relates to control group, black triangles with continuous line to the 1.15 g/kg/day alcohol-treated group, empty triangles with dashed line to the 1.15 g/kg/day alcohol + GPC-treated group, black squares with continuous line to 2.7 g/kg/day alcohol-treated group, and empty squares with dashed line to the 2.7 g/kg/day alcohol + GPC-treated group. During the measurement on day 1, all the rats were untreated. Mean values and standard error of mean (SEM) are given; *p < 0.05, **p < 0.01 and ***p < 0.001 vs. Control group, ###p < 0.001 vs. corresponding GPC-treated groups. Statistics: Two-way ANOVA, Bonferroni post-hoc test.
Figure 4
Figure 4
Oxygen consumption of rat liver mitochondria. O2 consumption rate of mitochondria was assessed in liver homogenate after addition of 0.5 μM rotenone, 10 mM succinate and 2.5 mM ADP on day 9 of investigation. The 2.7 g/kg/day ethanol-fed group had decreased mitochondrial function compared to control, whereas the GPC treatment prevented the decline of mitochondrial oxygen consumption, demonstrated by higher levels compared to both non-GPC treated ethanol-fed groups. Mean values and standard error of mean (SEM) are given; **p < 0.01 vs. Control, #p < 0.05 vs. corresponding GPC-treated groups. Statistics: One-way ANOVA with Bonferroni post-hoc test.
Figure 5
Figure 5
Oxygen consumption of rat hippocampus mitochondria. O2 consumption rate of mitochondria was assessed in hippocampus homogenate after addition of 0.5 μM rotenone, 10 mM succinate and 2.5 mM ADP on day 9 of investigation. Mitochondrial respiratory capacity deteriorated upon alcohol intake regardless of GPC treatment. Mean values and standard error of mean (SEM) are given; ***p < 0.001 vs. Control. Statistics: One-way ANOVA with Bonferroni post-hoc test.
Figure 6
Figure 6
Liver-specific enzyme levels before and after alcohol consumption in rats. Enzyme levels were determined in plasma from blood samples taken on days 1 (untreated control, left boxes) and 8 (last day of alcohol treatment, right boxes) of the investigation. The 1.15 g/kg/day alcohol (panels A–C) and 1.15 g/kg/day alcohol + GPC-fed group (panels D–F) were monitored with same method. Both Aspartate aminotransferase (AST, panels A and D) and Alanine aminotransferase (ALT, panels B and E) levels increased significantly as compared to baseline. Alkaline phosphatase (AP, panels C and F) levels did not change. Mean values and standard error of mean (SEM) are given; *p < 0.05 vs. day 1 (Control). Statistics: Paired t-test.

References

    1. de Lacy Costello BP, Ledochowski M, Ratcliffe NM. The importance of methane breath testing: a review. J Breath Res. 2013;7:024001. doi: 10.1088/1752-7155/7/2/024001. - DOI - PubMed
    1. Nose K, Nunome Y, Kondo T, Araki S, Tsuda T. Identification of gas emanated from human skin: methane, ethylene, and ethane. Anal Sci. 2005;21:625–628. doi: 10.2116/analsci.21.625. - DOI - PubMed
    1. Szabo A, et al. Exhaled methane concentration profiles during exercise on an ergometer. J Breath Res. 2015;9:016009. doi: 10.1088/1752-7155/9/1/016009. - DOI - PMC - PubMed
    1. Keppler F, et al. Stable isotope and high precision concentration measurements confirm that all humans produce and exhale methane. J Breath Res. 2016;10:016003. doi: 10.1088/1752-7155/10/1/016003. - DOI - PubMed
    1. Ghyczy M, Boros M. Electrophilic methyl groups present in the diet ameliorate pathological states induced by reductive and oxidative stress: a hypothesis. Br J Nutr. 2001;85:409–414. doi: 10.1079/BJN2000274. - DOI - PubMed

Publication types