. 2017 Aug 4;7(1):7292.
doi: 10.1038/s41598-017-07402-6.

Neurite elongation is highly correlated with bulk forward translocation of microtubules

Affiliations

Neurite elongation is highly correlated with bulk forward translocation of microtubules

Ahmad I M Athamneh et al. Sci Rep. .

Abstract

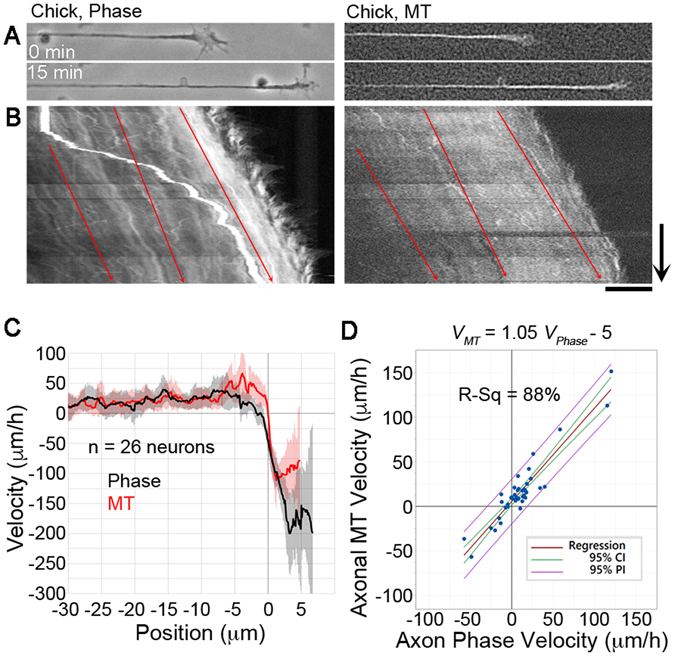
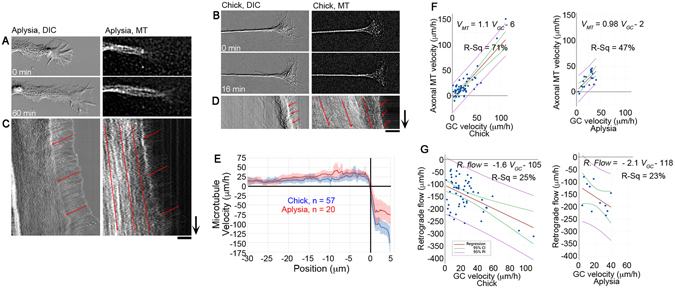
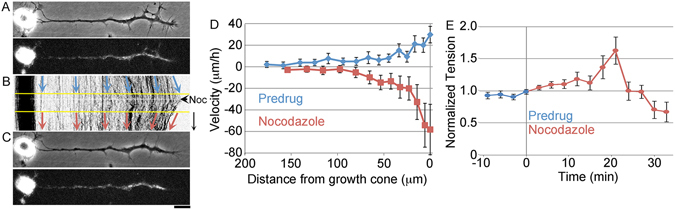
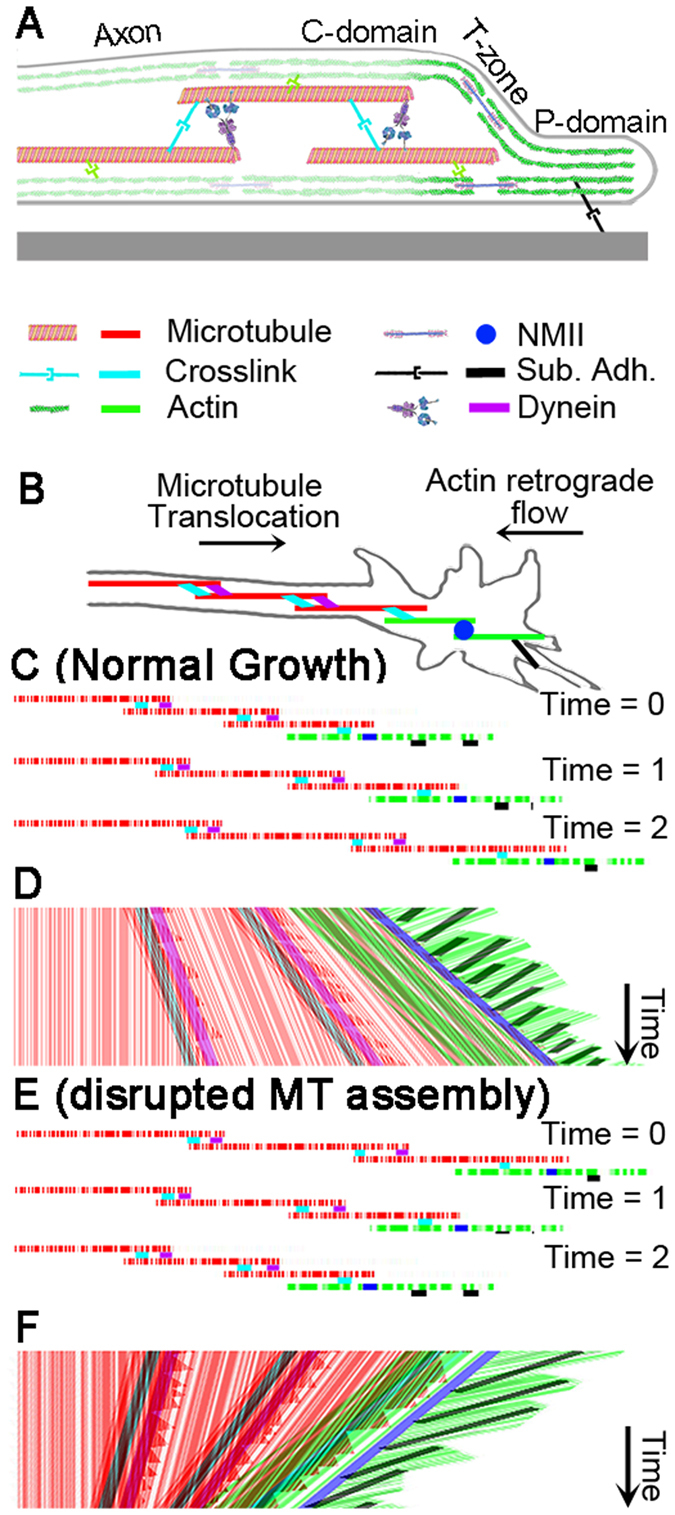
During the development of the nervous system and regeneration following injury, microtubules (MTs) are required for neurite elongation. Whether this elongation occurs primarily through tubulin assembly at the tip of the axon, the transport of individual MTs, or because MTs translocate forward in bulk is unclear. Using fluorescent speckle microscopy (FSM), differential interference contrast (DIC), and phase contrast microscopy, we tracked the movement of MTs, phase dense material, and docked mitochondria in chick sensory and Aplysia bag cell neurons growing rapidly on physiological substrates. In all cases, we find that MTs and other neuritic components move forward in bulk at a rate that on average matches the velocity of neurite elongation. To better understand whether and why MT assembly is required for bulk translocation, we disrupted it with nocodazole. We found this blocked the forward bulk advance of material along the neurite and was paired with a transient increase in axonal tension. This indicates that disruption of MT dynamics interferes with neurite outgrowth, not by disrupting the net assembly of MTs at the growth cone, but rather because it alters the balance of forces that power the bulk forward translocation of MTs.


Conflict of interest statement

The authors declare that they have no competing interests.

Figures

Figure 1
Figure 1
Axonal MTs and docked mitochondria translocate anterogradely during axonal elongation. (A) Still images of a chick DRG growth cone at the beginning and end of a time-lapse sequence in DIC, mitochondrial, MT fluorescent channels, and merged channels. Yellow arrow marks the T zone. (B) Kymograph showing motion. Red arrows indicate a mitochondrion and MT speckle undergoing fast transport. Scale and time bar as indicated. (C) Traces used to measure motion; arrow 10 min and bar 10 μm. (D) Input and output of LKMTA and KymoFlow algorithms for a subset of angles with color coded local velocities. (E) Input versus output shown as the average ± sd of velocity in units of p/f. (F) Average absolute error in degrees as a function of input angle. (G) Raw and sheared KymoFlow maps with color-coded velocities; arrow 10 min and bar 10 μm. (H) Velocity as a function of distance for the shown example. Position 0 corresponds with the growth cone T zone, where retrograde flow transitions into anterograde motion. (I) Velocity ± 95% CI as a function of distance for 31 neurons. (J) Regression analysis of docked mitochondrial and axonal MT velocity for 31 neurons.
Figure 2
Figure 2
Phase-dense material and MTs move anterogradely during axonal elongation. (A) Phase contrast and MT FSM still images of a chick DRG neurite at the beginning and end of a time-lapse sequence. (B) Phase and MT kymographs showing anterograde flow; arrow = 5 min, bar = 10 μm. The red arrows are guides to illustrate motion. (C) Velocity ± 95% CI of phase-dense objects and MTs in 26 neurons. (D) Regression analysis of the motion of phase-dense objects and MTs.
Figure 3
Figure 3
The pattern of MT motion is conserved between chick and Aplysia. Still images at the beginning and end of time-lapse sequences in (A) Aplysia and (B) chick neurons. Kymographs of (C) Aplysia and (D) chick neurons with red arrows indicating anterograde motion of MTs in axons and retrograde flow of phase dense material in the growth cone P domain; arrows = 10 min, bars = 10 μm. (E) MT velocity as a function of distance from the T zone. (F) Regression analysis of axonal MT and growth cone velocity. (G) Regression analysis of growth cone and retrograde flow velocity.
Figure 4
Figure 4
Disruption of MT assembly induces bulk retraction. (A) Still phase and fluorescent images showing the distribution of MitoTracker labeled mitochondria in a chick sensory neuron. (B) Kymograph illustrating the bulk forward advance of docked mitochondria before drug application, and bulk retraction following disruption of MT assembly with 1.6 μM nocodazole; arrow = 15 min. (C) Still images at the end of the time- lapse sequence; bar = 20 μm. (D) Velocity profile of the motion of docked mitochondria before and after drug treatment (n = 31 neurons). (E) Normalized neurite tension before and after drug treatment (n = 10 neurons).
Figure 5
Figure 5
Model of neurite elongation by bulk forward translocation of MTs. (A) Side view of growth cone and distal neurite with important cytoskeletal elements. (B) Schematic of a growth cone and distal neurite with important cytoskeletal components and substrate adhesion (black). (C) Three MTs (red) and two actin filaments (green) labeled with fluorescent speckles at different time points. (D) Hypothetical kymograph of MTs (red), F-actin (green), motors (purple and blue), and cross linking proteins (light blue). Anterograde red lines reveal forward movement of MTs in the distal neurite and C-domain and retrograde green lines reveal retrograde movement of F-actin in P domain. (E) Illustration of MT and F-actin configuration under conditions where disruption of MT assembly induces retraction of the growth cone. (F) A hypothetical kymograph of MT and F-actin motion. While axonal frictional interactions with the substrate, as well as axonal actin and myosin activity are all important for both elongation and retraction, they are not shown to minimize the complexity of the figure.

References

    1. Olesen J, et al. The economic cost of brain disorders in Europe. Eur J Neurol. 2012;19:155–162. doi: 10.1111/j.1468-1331.2011.03590.x. - DOI - PubMed
    1. Conde C, Caceres A. Microtubule assembly, organization and dynamics in axons and dendrites. Nat Rev Neurosci. 2009;10:319–332. doi: 10.1038/nrn2631. - DOI - PubMed
    1. Lowery LA, Van Vactor D. The trip of the tip: understanding the growth cone machinery. Nat Rev Mol Cell Biol. 2009;10:332–343. doi: 10.1038/nrm2679. - DOI - PMC - PubMed
    1. Bray D. Surface movements during the growth of single explanted neurons. Proc Natl Acad Sci USA. 1970;65:905–910. doi: 10.1073/pnas.65.4.905. - DOI - PMC - PubMed
    1. Okabe S, Hirokawa N. Turnover of fluorescently labelled tubulin and actin in the axon. Nature. 1990;343:479–482. doi: 10.1038/343479a0. - DOI - PubMed

Publication types

LinkOut - more resources