. 2017 Nov;130(11):2283-2295.
doi: 10.1007/s00122-017-2959-4. Epub 2017 Aug 5.

Is there an optimum level of diversity in utilization of genetic resources?

Affiliations

Is there an optimum level of diversity in utilization of genetic resources?

Manfred Mayer et al. Theor Appl Genet. 2017 Nov.

Abstract

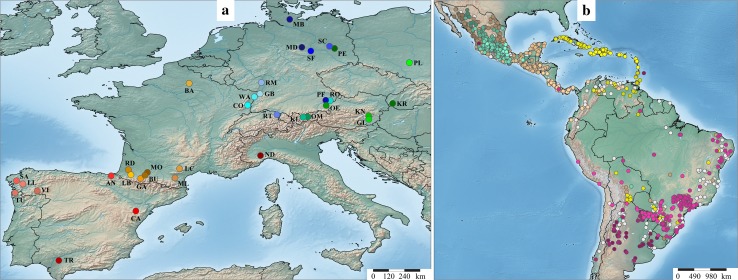
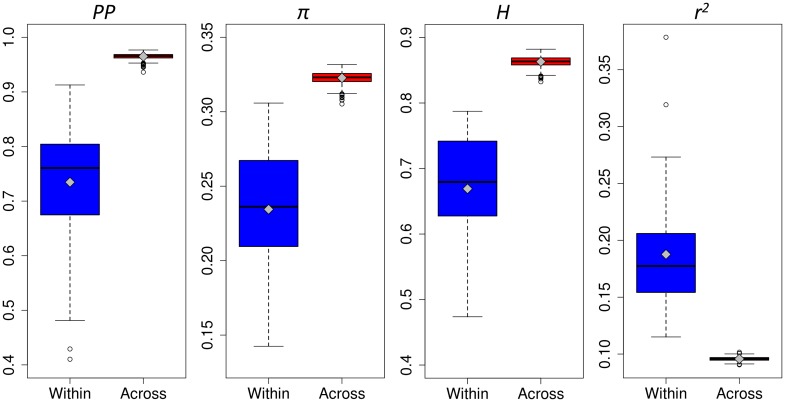
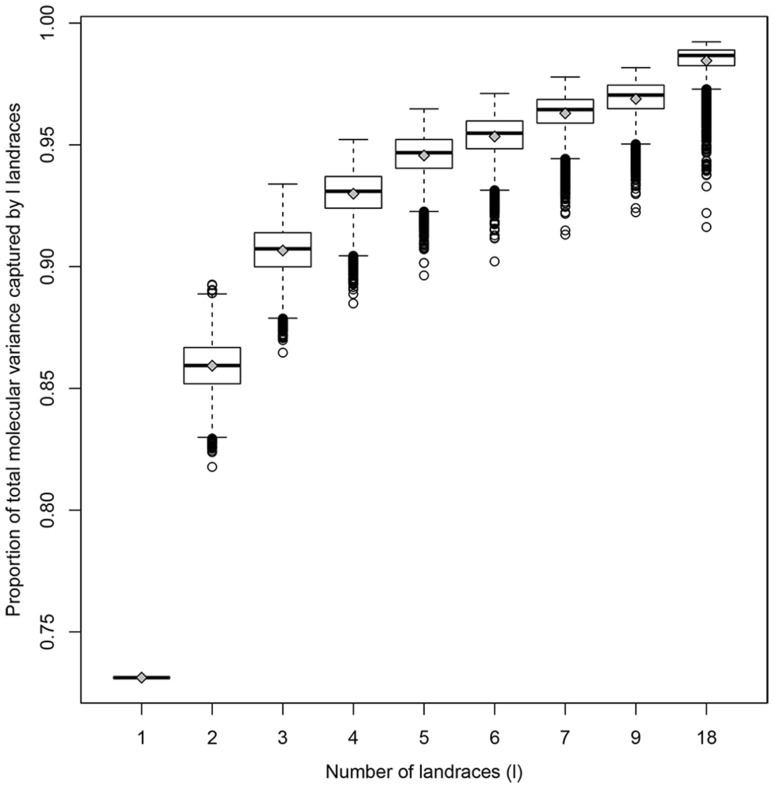
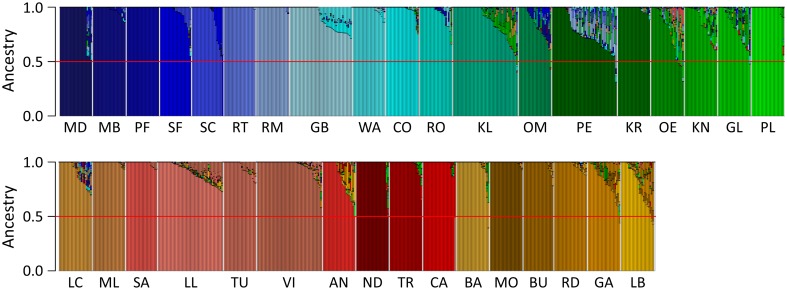
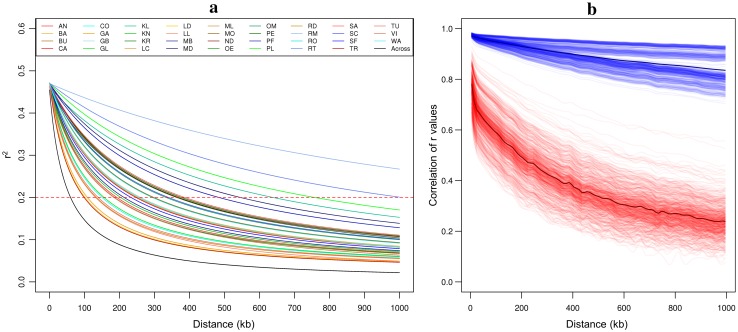
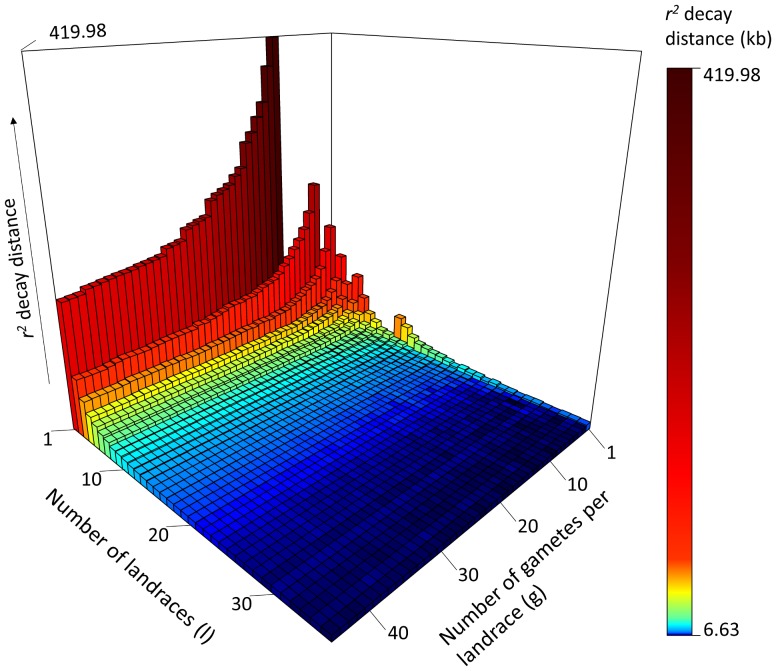
Capitalizing upon the genomic characteristics of long-term random mating populations, sampling from pre-selected landraces is a promising approach for broadening the genetic base of elite germplasm for quantitative traits. Genome-enabled strategies for harnessing untapped allelic variation of landraces are currently evolving. The success of such approaches depends on the choice of source material. Thus, the analysis of different strategies for sampling allelic variation from landraces and their impact on population diversity and linkage disequilibrium (LD) is required to ensure the efficient utilization of diversity. We investigated the impact of different sampling strategies on diversity parameters and LD based on high-density genotypic data of 35 European maize landraces each represented by more than 20 individuals. On average, five landraces already captured ~95% of the molecular diversity of the entire dataset. Within landraces, absence of pronounced population structure, consistency of linkage phases and moderate to low LD levels were found. When combining data of up to 10 landraces, LD decay distances decreased to a few kilobases. Genotyping 24 individuals per landrace with 5k SNPs was sufficient for obtaining representative estimates of diversity and LD levels to allow an informed pre-selection of landraces. Integrating results from European with Central and South American landraces revealed that European landraces represent a unique and diverse spectrum of allelic variation. Sampling strategies for harnessing allelic variation from landraces depend on the study objectives. If the focus lies on the improvement of elite germplasm for quantitative traits, we recommend sampling from pre-selected landraces, as it yields a wide range of diversity, allows optimal marker imputation, control for population structure and avoids the confounding effects of strong adaptive alleles.


Conflict of interest statement

Conflict of interest

On behalf of all authors, the corresponding author states that there is no conflict of interest.

Ethical standards

The authors declare that this study complies with the current laws of the countries in which the experiments were performed.

Figures

Fig. 1
Fig. 1
Geographical origin of European (a) and American (b) maize landraces investigated in this study. a North-eastern and south-western European landraces (Table S1) are colored in blue/green and red/orange, respectively. b The coloring of the American landraces from the SeeD project (Table S2) refers to different geographical macro regions: Caribbean islands (yellow), Central American and Mexican lowlands (brown), South America (violet-red) and Mexican highlands (aquamarine). The grouping of landraces was inferred by the analysis of population structure using ADMIXTURE with 16 genetic groups. Admixed landraces with less than 50% of their ancestry attributable to one of the 16 genetic groups are shown in light gray
Fig. 2
Fig. 2
Genetic diversity and LD within and across European landraces. Proportion of polymorphic markers (PP), mean nucleotide diversity per marker (π), mean haplotype heterozygosity (H) and LD (mean r 2) were calculated based on dataset EU-Array. Boxplots represent values for samples of 22 to 24 individuals within each landrace (blue), and for 1000 random samples of 24 individuals across landraces (red). Boxplots show the upper and lower quartile, median (horizontal bar), mean (gray diamond) and whiskers (vertical bars) of the respective statistic. Points above and below the whiskers indicate values ±1.5 times the interquartile range
Fig. 3
Fig. 3
Proportion of the total molecular variance captured by different numbers of landraces. Landraces of EU-Array, with 22 to 24 individuals per landrace, were randomly assigned to groups comprising l landraces, with l = 1, 2, 3, 4, 5, 6, 7, 9, 18. The proportion of the total molecular variance of the panel of 35 landraces captured by groups of l landraces was estimated using AMOVA. Boxplots show the upper and lower quartile, median (horizontal bar), mean (gray diamond) and whiskers (vertical bars) for 10,000 random repeats per l. Points above and below the whiskers indicate values ±1.5 times the interquartile range
Fig. 4
Fig. 4
Population structure in European landraces. Population structure within dataset EU-Array was inferred using ADMIXTURE for 35 pre-defined genetic groups, colored according to Fig. 1a. Each bar represents one individual consisting of up to 35 colors according to their ancestry proportions attributable to each of the 35 genetic groups. The red horizontal line indicates an ancestry proportion of 50%. Landraces are ordered according to their position in the neighbor joining tree (Fig S3), with north-eastern and south-western European landraces at the top and bottom, respectively
Fig. 5
Fig. 5
Decay of LD with physical distance and correlation of r within and across European landraces. a The decay of LD was estimated via non-linear regression using r 2 values for marker pairs within a maximum distance of 1 Mb. Based on dataset EU-Array, estimates for samples of 22 to 24 individuals within each landrace (colored according to Fig. 1a) and the mean over 1000 random samples of 24 individuals across landraces (black) are shown. The red dashed line indicates the threshold of r 2 = 0.2 for calculating the physical LD decay distance. b Cubic smoothing spline fits are shown for the correlation of r values between samples within (blue) and across (red) landraces as a function of physical distance, based on dataset EU-Array. For the within-landrace estimates, 100 times half of the individuals within each of the five landraces with n LR ≥ 46 (Table S1) were randomly sampled and compared with the second half. Across-landrace estimates are based on pairwise comparisons of all 35 landraces. Mean values for within- and across-landrace estimates are shown in dark blue and dark red, respectively
Fig. 6
Fig. 6
Effects of sample size and sample composition on the estimation of LD decay distances. Based on dataset EU-OL, LD decay distances were calculated using non-linear regression and an r 2 threshold of 0.2 for sampling schemes varying in the number of landraces l and the number of gametes g per landrace. Bars and colors represent the average LD decay distance for 10 random samples per l × g combination

References

    1. Alexander DH, Novembre J, Lange K. Fast model-based estimation of ancestry in unrelated individuals. Genome Res. 2009;19:1655–1664. doi: 10.1101/gr.094052.109. - DOI - PMC - PubMed
    1. Böhm J, Schipprack W, Utz HF, Melchinger AE. Tapping the genetic diversity of landraces in allogamous crops with doubled haploid lines: a case study from European flint maize. Theor Appl Genet. 2017;130:861–873. doi: 10.1007/s00122-017-2856-x. - DOI - PubMed
    1. Browning BL, Browning SR. A unified approach to genotype imputation and haplotype-phase inference for large data sets of trios and unrelated individuals. Am J Hum Genet. 2009;84:210–223. doi: 10.1016/j.ajhg.2009.01.005. - DOI - PMC - PubMed
    1. Chia J-M, Song C, Bradbury PJ, Costich D, de Leon N, Doebley J, Elshire RJ, Gaut B, Geller L, Glaubitz JC, Gore M, Guill KE, Holland J, Hufford MB, Lai J, Li M, Liu X, Lu Y, McCombie R, Nelson R, Poland J, Prasanna BM, Pyhajarvi T, Rong T, Sekhon RS, Sun Q, Tenaillon MI, Tian F, Wang J, Xu X, Zhang Z, Kaeppler SM, Ross-Ibarra J, McMullen MD, Buckler ES, Zhang G, Xu Y, Ware D. Maize HapMap2 identifies extant variation from a genome in flux. Nat Genet. 2012;44:803–807. doi: 10.1038/ng.2313. - DOI - PubMed
    1. Conrad DF, Jakobsson M, Coop G, Wen X, Wall JD, Rosenberg NA, Pritchard JK. A worldwide survey of haplotype variation and linkage disequilibrium in the human genome. Nat Genet. 2006;38:1251–1260. doi: 10.1038/ng1911. - DOI - PubMed

LinkOut - more resources