. 2017 Aug 21;27(16):2465-2475.e3.
doi: 10.1016/j.cub.2017.06.084. Epub 2017 Aug 3.

Direct Midbrain Dopamine Input to the Suprachiasmatic Nucleus Accelerates Circadian Entrainment

Affiliations

Direct Midbrain Dopamine Input to the Suprachiasmatic Nucleus Accelerates Circadian Entrainment

Ryan M Grippo et al. Curr Biol. .

Abstract

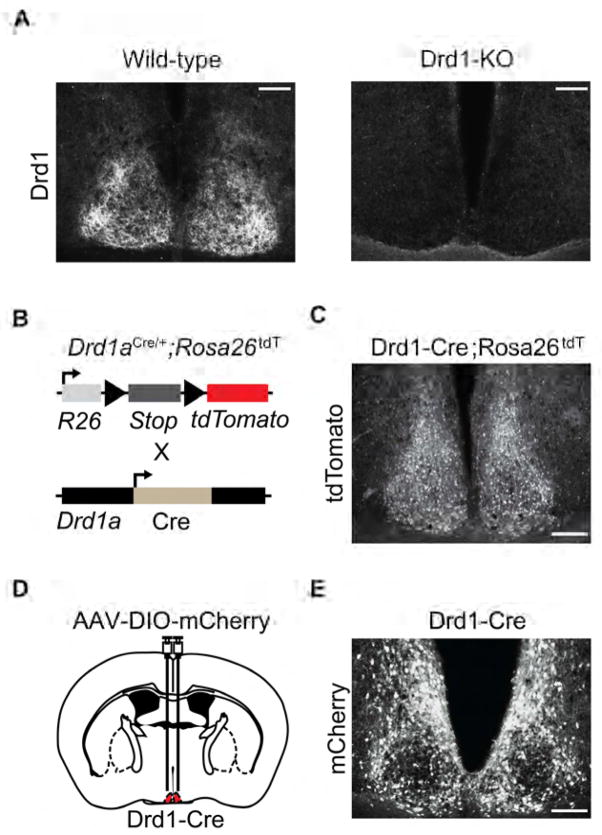
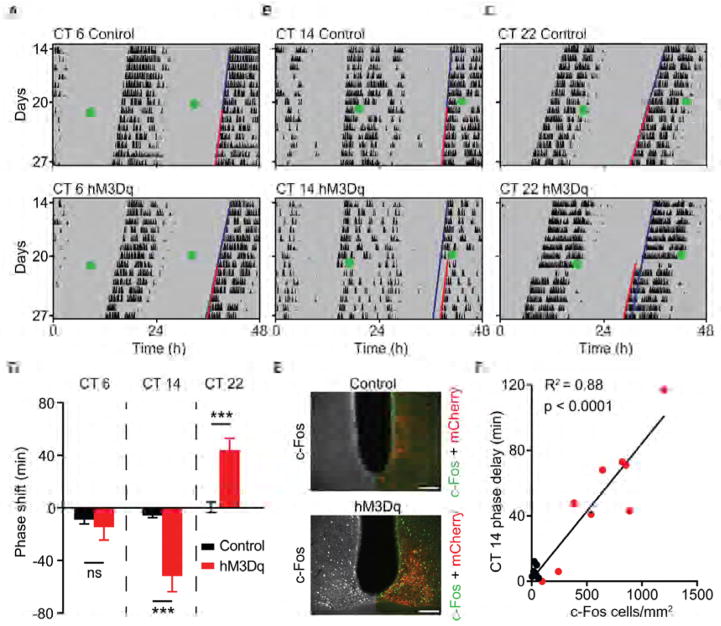
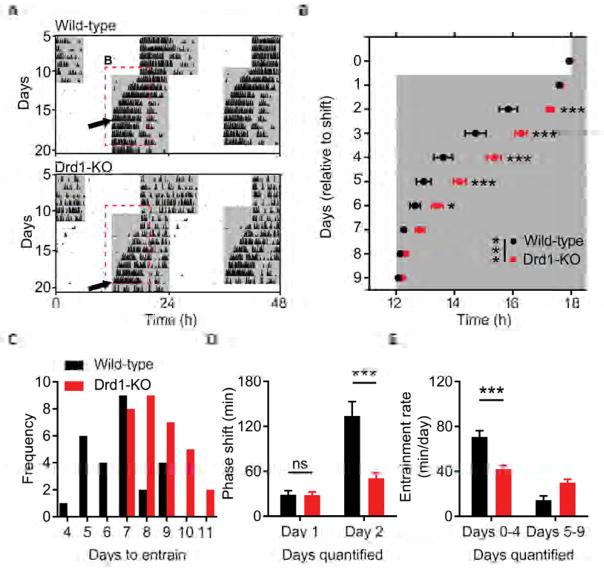
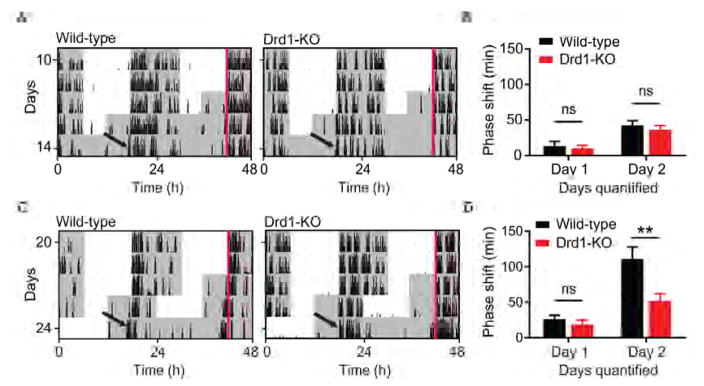
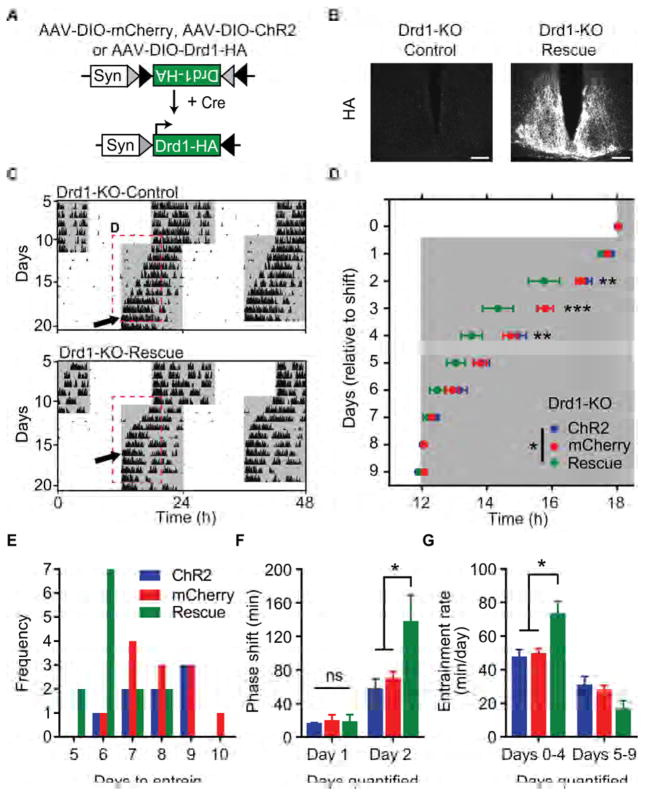
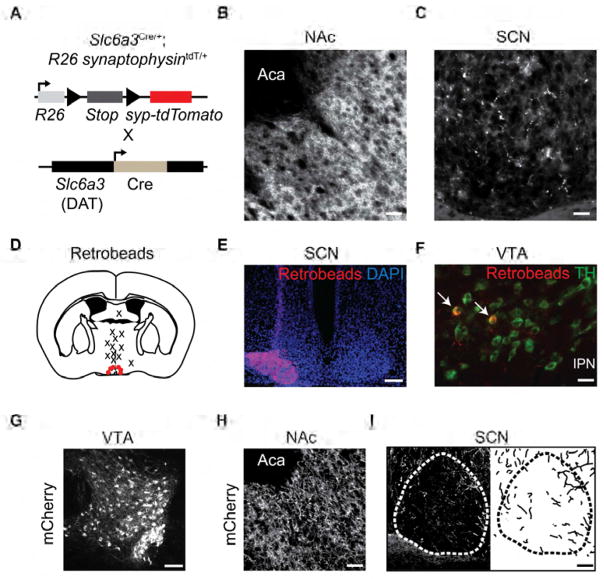
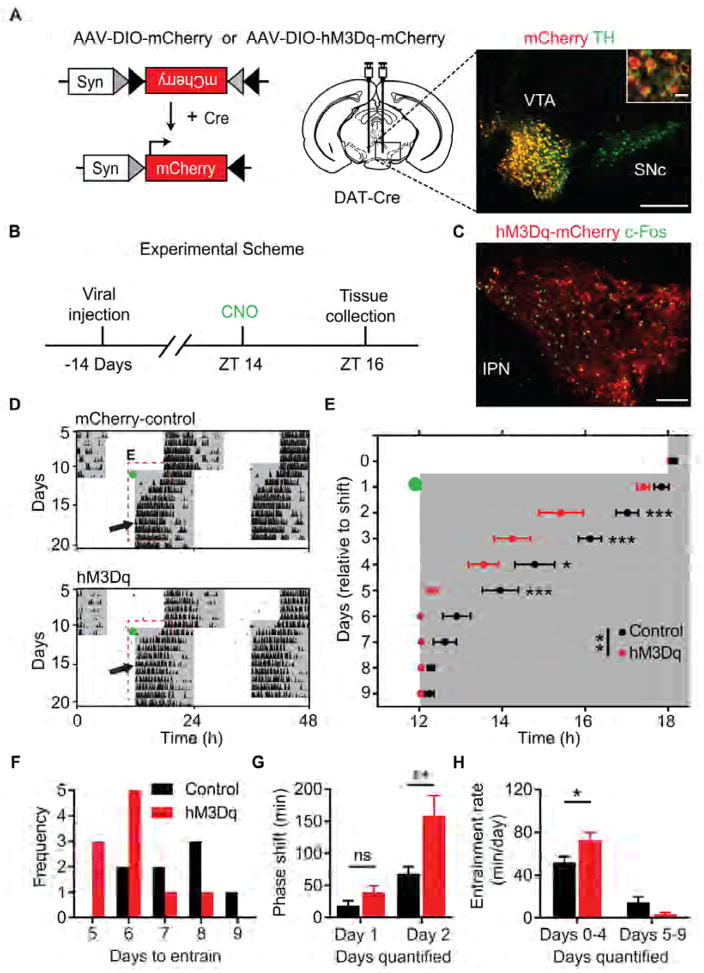
Dopamine (DA) neurotransmission controls behaviors important for survival, including voluntary movement, reward processing, and detection of salient events, such as food or mate availability. Dopaminergic tone also influences circadian physiology and behavior. Although the evolutionary significance of this input is appreciated, its precise neurophysiological architecture remains unknown. Here, we identify a novel, direct connection between the DA neurons of the ventral tegmental area (VTA) and the suprachiasmatic nucleus (SCN). We demonstrate that D1 dopamine receptor (Drd1) signaling within the SCN is necessary for properly timed resynchronization of activity rhythms to phase-shifted light:dark cycles and that elevation of DA tone through selective activation of VTA DA neurons accelerates photoentrainment. Our findings demonstrate a previously unappreciated role for direct DA input to the master circadian clock and highlight the importance of an evolutionarily significant relationship between the circadian system and the neuromodulatory circuits that govern motivational behaviors.

Keywords: D1 dopamine receptor; SCN; circadian entrainment; dopamine; dopaminergic neurons; hypothalamic circuitry; jet lag; photoentrainment; suprachiasmatic nucleus; ventral tegmental area.


Figures

Figure 1
Figure 1. Drd1 is Expressed in the SCN Through Adulthood
(A) Fluorescent immunohistochemistry with Drd1 antibody labeling in the SCN of wild-type and Drd1-KO mice. Scale bar, 100 μm. (B) Schematic representation of Drd1-neuron specific Cre-mediated recombination in Drd1-Cre mice crossed with ROSA26-tdTomato Cre-dependent reporter mice. (C) Presence of tdTomato positive cells within the SCN (central) of Drd1-Cre;ROSA26tdT mice. Scale bar, 100 μm. See also Figure S1. (D) Schematic diagram illustrating the site of AAV-DIO-mCherry bilateral injection to the SCN (central) of Drd1-Cre mice. (E) Fluorescent immunohistochemistry of Cre-dependent mCherry expression within the SCN of Drd1-Cre mice. See also Figure S1.
Figure 2
Figure 2. Phase Shift of Behavioral Rhythms by Activation of Drd1-SCN Neurons
(A) Representative double-plotted actograms (white and grey backgrounds; light and dark, respectively) of circadian time (CT) 6, (B) CT 14 and (C) CT 22 CNO-treated mCherry (control, top) and hM3Dq-mCherry (bottom) mice. Green dot indicates CNO injection (1 mg/kg, i.p.). Grey shading indicates constant darkness; dark blue line represents extended regression line derived by activity onsets prior to CNO; red line follows actual onset of activity after CNO. (D) Duration of phase shift (minutes) in response to CNO injection (1 mg/kg, i.p.), *** p < 0.001. (E) Fluorescent immunohistochemistry of c-Fos within the SCN (anterior) (Left hemisphere: greyscale; right hemisphere: double fluorescent immunohistochemistry of c-Fos (green) and mCherry (red) antibody labelling 120 minutes after CNO. (F) Positive correlation between the duration of phase shift and c-Fos positive cells/mm2 within the SCN, R2= 0.88, n = 7–9/group; p < 0.0001, linear regression. Scale bars, 100 μm. Data are represented as mean ± SEM. See also Table S1.
Figure 3
Figure 3. Delayed Entrainment of Behavioral Rhythms in Drd1-KO Mice
(A) Representative double-plotted actograms of light cycle shift comparing wild-type and Drd1-KO mice. White and grey background indicates the; light and dark phase of the LD cycle respectively. Dotted red lines outline onset data represented in b; black arrows indicate the day of entrainment. (B) Group analysis of activity onset; F (1, 50) = 16.55; p = 0.0002, repeated-measures two-way ANOVA with Bonferroni post hoc comparison; n = 26/group. * p < 0.05, ** p < 0.01, *** p < 0.001. (C) Frequency of mice per number of days required to entrain wheel running activity to the new light cycle. (D) Group analysis of day 1 and day 2 cumulative phase shift; F (1, 50) = 11.83; p = 0.0012, repeated-measures two-way ANOVA with Bonferroni post hoc comparison; n = 26/group. *** p < 0.001. (E) Rate of entrainment calculated by the slope of activity onsets divided into two segments: days 0–4 and days 5–9 relative to the light cycle shift; repeated-measures two-way ANOVA with Bonferroni post hoc comparison, *** p < 0.001. Data are represented as mean ± SEM. See also Figures S2, S3 and Table S1.
Figure 4
Figure 4. Drd1 Modulation of Entrainment Rate Requires Light Input
(A) Representative double-plotted actograms of wild-type and Drd1-KO mice following a 6-hour advance and immediate release into DD. (B) Group analysis of day 1 and day 2 cumulative phase shift; F (1, 14) = 0.3684; p = 0.5536, repeated-measures two-way ANOVA; n = 8/group. (C) Representative double-plotted actograms of wild-type and Drd1-KO mice following a 6-hour full LD cycle advance followed by release into DD. Red lines outline ZT 12 prior to LD shift. (D) Group analysis of day 1 and day 2 cumulative phase shift; F (1, 14) = 7.40; p = 0.0166, repeated-measures two-way ANOVA with Bonferroni post hoc comparison; n = 8/group. ** p < 0.01. Data are represented as mean ± SEM.
Figure 5
Figure 5. Viral Restoration of Drd1 within the SCN Rescues Entrainment in Drd1-KO Mice
(A) Schematic representation of the Cre-dependent AAV-DIO-Drd1-HA construct. (B) Fluorescent immunohistochemistry of HA antibody labelling within the SCN (central) of mCherry expressing controls (Drd1-KO-Control) and Drd1-HA expressing (Drd1-KO-Rescue) rescue mice. Scale bar, 100 μm. (C) Representative double-plotted actograms of light cycle shift comparing Drd1-KO-mCherry and Drd1-KO-Rescue mice. (D) Group analysis of activity onset; F (2, 30) = 5.073; p = 0.0127, repeated-measures two-way ANOVA with Bonferroni post hoc comparison; n = 8–13/group; * p < 0.05, ** p < 0.01, *** p < 0.001. (E) Frequency of mice per number of days required to entrain wheel running activity to the new light cycle. (F) Group analysis of day 1 and day 2 cumulative phase shift; F (2, 30) = 3.319; p = 0.0499, repeated-measures two-way ANOVA with Bonferroni post hoc comparison; * p < 0.05. (G) Rate of re-entrainment calculated by the slope of activity onsets, repeated-measures two-way ANOVA with Bonferroni post hoc comparison, ** p < 0.01. Data are represented as mean ± SEM. See also Figure S3 and Table S1.
Figure 6
Figure 6. Identification of VTA DA-Neuron Projections and Drd1 Expression within the SCN
(A) Schematic representation of DA-neuron specific expression of synaptophysin-tdTomato in DAT-Cre mice crossed with ROSA26-synaptophysin-tdTomato Cre-dependent reporter mice. (B) Dense innervation within the nucleus accumbens and (C) moderate innervation within SCN (central). Scale bar, 50 μm. (D) Coronal diagram indicating retrobead target sites. Red dots specify positive SCN targeting and X’s represent dorsal targeted controls. (E) Pseudo-colored images of retrobeads (beads; red) and DAPI (blue) confirming positive targeting of the SCN. Scale bar, 100 μm. (F) Fluorescent immunohistochemistry of retrobeads (red) colocalized within TH (green) positive neurons in the VTA. Scale bar, 50 μm. (G) Fluorescent immunohistochemistry with mCherry antibody labelling of VTA target site. Scale bar, 100 μm. (H) Immunoreactive mCherry fibers within the nucleus accumbens (NAc). Scale bar, 50 μm. (I) Left: Immunoreactive mCherry fibers within and around the SCN (anterior). Right: trace of innervating mCherry fibers. Scale bar, 50 μm. See also Figure S4.
Figure 7
Figure 7. DREADD Activation of VTA Neurons Accelerates Circadian Entrainment
(A) Left: Design of Cre-dependent control virus, AAV-DIO-mCherry, or excitatory Gq-coupled DREADD, AAV-DIO-hM3Dq-mCherry. Syn: human synapsin promotor; Cre: Cre recombinase. Middle: Schematic illustrating injection site to the midbrain of DAT-Cre mice. Right: double fluorescent immunohistochemistry with mCherry (red) and TH (green) antibody labelling demonstrating selective transgene expression within DA-neurons of the ventral tegmental area. VTA: ventral tegmental area; SNc: Substantia nigra pars compacta. Scale bar, 200 μm; inset scale bar, 20 μm. (B) Timeline of experiment assessing CNO-induced (1mg/kg, i.p.) c-Fos expression two hours after lights-off; Zeitgeber time 14 (ZT 14). (C) Double fluorescent immunohistochemistry with c-Fos (green) and mCherry (red) antibody labelling reveals activation of VTA DA-neurons. Brains were collected for analysis 120 minutes after CNO injection (1mg/kg, i.p.). IPN: interpeduncular nucleus. Scale bar, 100 μm. See also Figure S1. (D) Representative double-plotted actograms of light cycle shift comparing mCherry and hM3Dq-mCherry expressing DAT-Cre mice. Green dots indicate CNO injection (1mg/kg, i.p); black arrows indicate the day of entrainment. (E) Group analysis of activity onset; F (1, 14) = 12.74; p = 0.0031, repeated-measures two-way ANOVA with Bonferroni post hoc comparison; n = 8–9/group; * p < 0.05, ** p < 0.01, *** p < 0.001. (F) Frequency of mice per number of days required to entrain wheel running activity to the new light cycle. (G) Group analysis of day 1 and day 2 cumulative phase shift; F (1, 15) = 7.056; p = 0.0180, repeated-measures two-way ANOVA with Bonferroni post hoc comparison; n = 8–9/group; ** p < 0.01. (H) Rate of entrainment calculated by the slope of activity onsets; repeated-measures two-way ANOVA with Bonferroni post hoc comparison; * p < 0.05. Data are represented as mean ± SEM. See also Figure S5 and Table S1.

References

    1. Moore RY, Eichler VB. Loss of a circadian adrenal corticosterone rhythm following suprachiasmatic lesions in the rat. Brain Res. 1972;42:201–206. - PubMed
    1. Stephan FK, Zucker I. Circadian rhythms in drinking behavior and locomotor activity of rats are eliminated by hypothalamic lesions. Proc Natl Acad Sci U S A. 1972;69:1583–1586. - PMC - PubMed
    1. Barion A, Zee PC. A clinical approach to circadian rhythm sleep disorders. Sleep Med. 2007;8:566–577. - PMC - PubMed
    1. Arble DM, Ramsey KM, Bass J, Turek FW. Circadian disruption and metabolic disease: findings from animal models. Best Pract Res Clin Endocrinol Metab. 2010;24:785–800. - PMC - PubMed
    1. Davidson AJ, Sellix MT, Daniel J, Yamazaki S, Menaker M, Block GD. Chronic jet-lag increases mortality in aged mice. Curr Biol. 2006;16:R914–916. - PMC - PubMed