. 2017 Aug;13(8):771-775.
doi: 10.1038/nphys4104. Epub 2017 May 1.

High-frequency microrheology reveals cytoskeleton dynamics in living cells

Affiliations

High-frequency microrheology reveals cytoskeleton dynamics in living cells

Annafrancesca Rigato et al. Nat Phys. 2017 Aug.

Abstract

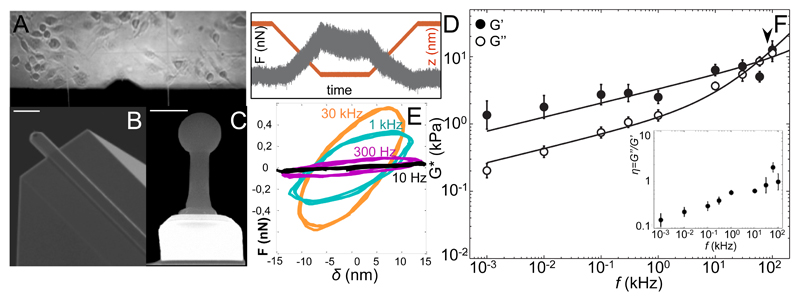
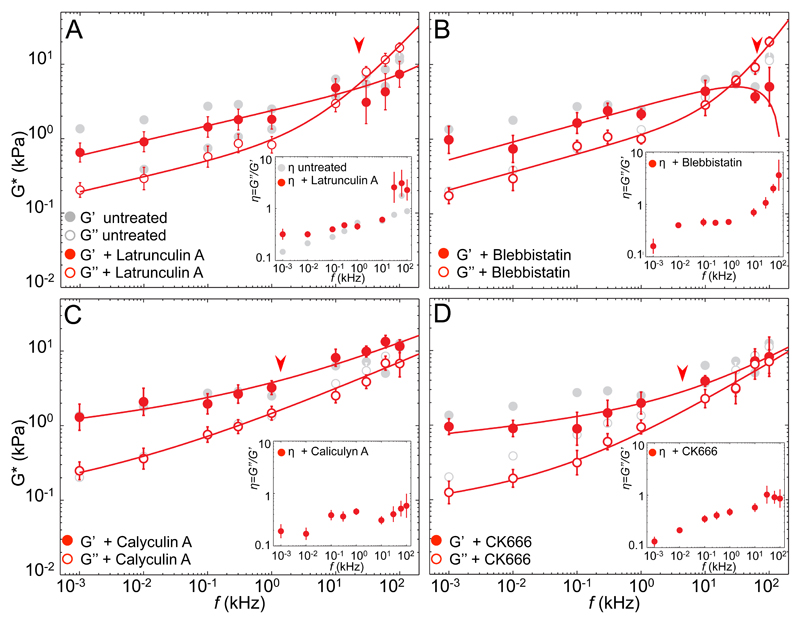
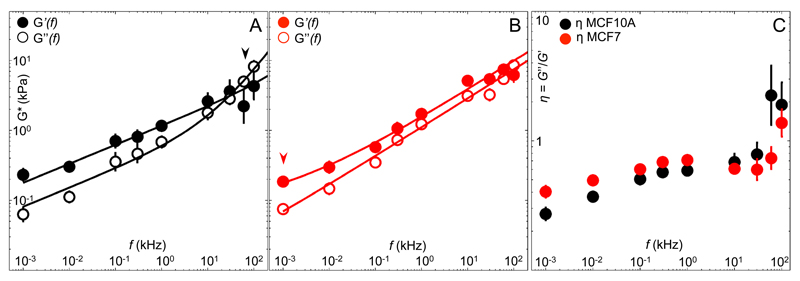
Living cells are viscoelastic materials, with the elastic response dominating at long timescales (≳1 ms)1. At shorter timescales, the dynamics of individual cytoskeleton filaments are expected to emerge, but active microrheology measurements on cells accessing this regime are scarce2. Here, we develop high-frequency microrheology (HF-MR) to probe the viscoelastic response of living cells from 1Hz to 100 kHz. We report the viscoelasticity of different cell types and upon cytoskeletal drug treatments. At previously inaccessible short timescales, cells exhibit rich viscoelastic responses that depend on the state of the cytoskeleton. Benign and malignant cancer cells revealed remarkably different scaling laws at high frequency, providing a univocal mechanical fingerprint. Microrheology over a wide dynamic range up to the frequency of action of the molecular components provides a mechanistic understanding of cell mechanics.


Figures

Figure 1
Figure 1. High-frequency microrheology (HF-MR) of living fibroblasts.
(A) Bright field image of living 3T3-fibroblasts in the HS-AFM fluid chamber. (B) Scanning electron micrograph of HS-AFM cantilever. Scale bar = 10 μm. (C) Front view of the AFM tip showing the electron beam deposited spherical tip. Scale bar = 1 μm. (D) Example of force-time trace with 1 kHz oscillation obtained on a living cell. The contact time, at ~250 nm indentation, shows force-relaxation with the superimposed oscillation. The maximum force is ~0.5 nN. The red line shows piezo displacement (550 nm + 15-nm amplitude oscillation). (E) Force-indentation loops obtained from the contact region of force curves at different oscillation frequencies showing increased slope and hysteresis with frequency. (F) Frequency-dependence of the complex shear modulus G*(f) = G’(f)+iG”(f) of 3T3 cells (N=22). Error bars represent the standard error of the mean of the log-transformed data. The arrowhead shows the transition frequency. Inset: loss tangent, η = G”/G’ as a function of frequency. Error bars represent the standard error of the mean.
Figure 2
Figure 2. High-frequency microrheology (HF-MR) of fibroblasts with altered actin cytoskeleton.
Frequency-dependent shear moduli and loss tangents (insets) for untreated cells (gray) and cells after cytoskeletal alterations (red). Arrowheads show the transition frequencies. (A) Disruption of the actin cytoskeleton by latrunculin-A (N=10) (B) Reduced presstress by blebbistatin (N=8) (C) Increased presstress by calyculin A (N=13), and (D) actin branching inhibition by CK666 (N=6). Solid lines represent the best fits of a double power law to treated cells. Fit parameters are shown in table 1. Error bars in G* represent the standard error of the mean of the log-transformed data. Error bars in η represent the standard error of the mean.
Figure 3
Figure 3. High-frequency microrheology (HF-MR) of benign and malignant cancer cells.
Frequency-dependent shear moduli of (A) benign (MCF10A, N=9) and (B) malignant (MCF7, N=9) cancer cells, and (C) frequency-dependent loss tangent η=G”(f)/G’(f). Arrowheads show the transition frequencies. Solid lines represent the best fits of a double power law with parameters shown in table 1. Error bars in G* represent the standard error of the mean of the log-transformed data. Error bars in η represent the standard error of the mean.

References

    1. Fabry B, Maksym GN, Butler J, Glogauer M, Navajas D, Fredberg JJ. Scaling the microrheology of living cells. Phys Rev Lett. 2001;87:148102–148105. - PubMed
    1. Deng LH, Trepat X, Butler JP, Millet E, Morgan KG, Weitz DA, et al. Fast and slow dynamics of the cytoskeleton. Nat Mater. 2006;5(8):636–640. - PubMed
    1. Petersen NO, McConnaughey WB, Elson EL. Dependence of locally measured cellular deformability on position on the cell, temperature, and cytochalasin B. Proc Natl Acad Sci U S A. 1982;79(17):5327–5331. - PMC - PubMed
    1. Kollmannsberger P, Fabry B. Linear and Nonlinear Rheology of Living Cells. Annual Review of Materials Research, Vol 41. 2011;41:75–97.
    1. Bausch A, Kroy K. A bottom-up approach to cell mechanics. Nature physics. 2006;2(4):231–238.