

Clinical application value of 3.0T MR diffusion tensor imaging in grade diagnosis of gliomas
- PMID: 28781644
- PMCID: PMC5530196
- DOI: 10.3892/ol.2017.6378
Clinical application value of 3.0T MR diffusion tensor imaging in grade diagnosis of gliomas
Abstract
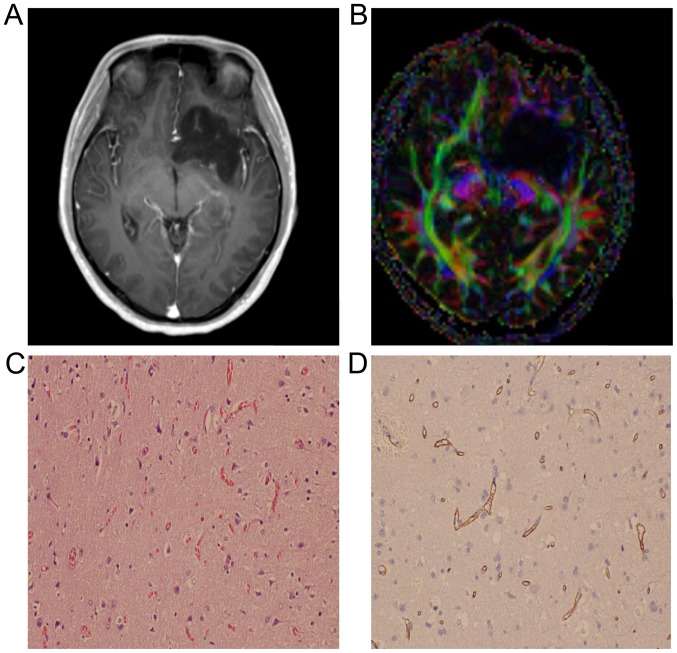
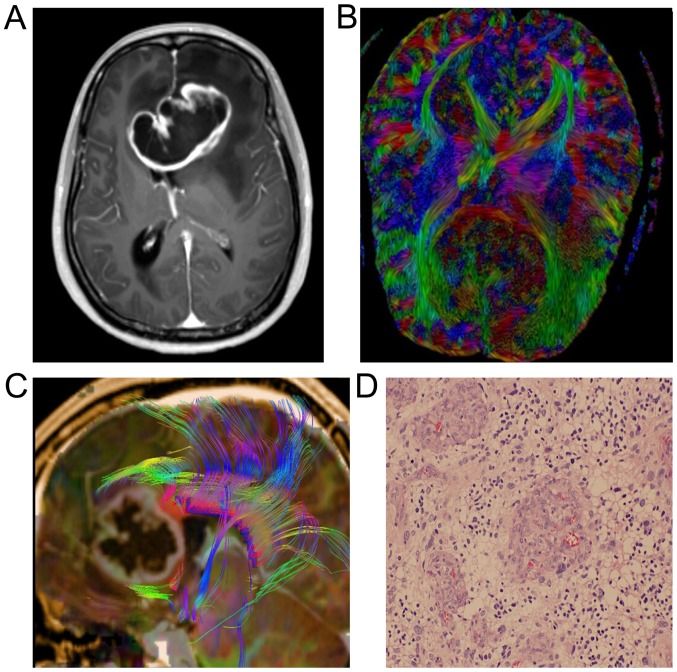
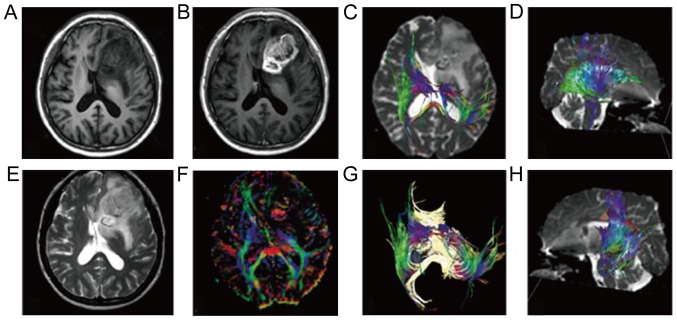
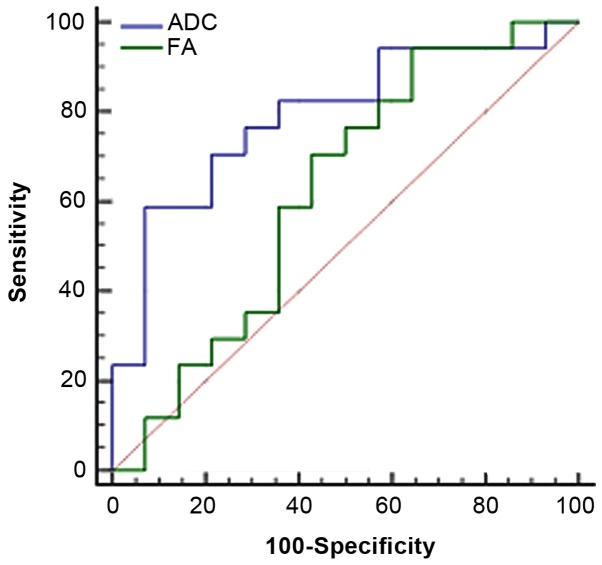
The clinical value of MR diffusion tensor imaging (DTI) in grade diagnosis of gliomas was investigated. A total of 31 patients with glioma were administered 3.0T MR convention and DTI examination, with quantitative measurement of anisotropy coefficient fractional anisotropy (FA) and apparent dispersion coefficient (ADC) value, and the comparison of quantitative parameters of glioma between low- and high-grade, which was detected by Mann-Whitney U test. The receiver operation characteristic (ROC) curve was drawn to take the value of ADC and FA in tumor ROI as a critical point, to calculate the area under the curve and to confirm the diagnosis threshold value and evaluate its diagnostic efficiency. The FA value of 14 low-grade glioma cases was 139.4±81.3, with an ADC value of (1.36±0.21) ×10-3 mm2/sec. The FA value of 17 high-grade glioma cases was 103.1±41.5, with ADC value of (1.09±0.28)-3 mm2/sec; the difference between the two groups was statistically significant (P<0.05). The ADC value was taken as the critical point to judge tumor grade and draw the ROC curve; the area under the curve was 0.79. As the diagnosis threshold value, the ADC value of 1.11×10⁻³ mm2/sec was used to distinguish between low- and high-grade tumor with a sensitivity of 58.8% and specificity of 92.9%. The FA value was taken as a critical point to judge tumor grade and draw the ROC curve; the area under the curve was 0.62. As the diagnosis threshold value, the FA value of 178.9 was applied to distinguish between low- and high-grade tumor sensitivity of 94.1% and specificity of 35.7%. Therefore, the FA value and ADC value in DTI has an important estimated value for the pathological grade of glioma.
Keywords: MR dynamic contrast-enhanced scan; diffusion tensor imaging; glioma; pathology.
Figures
Similar articles
-
In the assessment of supratentorial glioma grade: the combined role of multivoxel proton MR spectroscopy and diffusion tensor imaging.Clin Radiol. 2011 Oct;66(10):953-60. doi: 10.1016/j.crad.2011.05.001. Epub 2011 Jun 12. Clin Radiol. 2011. PMID: 21663899
-
Measurements of diagnostic examination performance using quantitative apparent diffusion coefficient and proton MR spectroscopic imaging in the preoperative evaluation of tumor grade in cerebral gliomas.Eur J Radiol. 2011 Nov;80(2):462-70. doi: 10.1016/j.ejrad.2010.07.017. Epub 2010 Aug 13. Eur J Radiol. 2011. PMID: 20708868
-
Analysis of diffusion tensor imaging metrics for gliomas grading at 3 T.Eur J Radiol. 2014 Mar;83(3):e156-65. doi: 10.1016/j.ejrad.2013.12.023. Epub 2014 Jan 4. Eur J Radiol. 2014. PMID: 24457139
-
The role of diffusion tensor imaging and fractional anisotropy in the evaluation of patients with idiopathic normal pressure hydrocephalus: a literature review.Neurosurg Focus. 2016 Sep;41(3):E12. doi: 10.3171/2016.6.FOCUS16192. Neurosurg Focus. 2016. PMID: 27581308 Review.
-
Diffusion imaging could aid to differentiate between glioma progression and treatment-related abnormalities: a meta-analysis.Insights Imaging. 2022 Oct 4;13(1):158. doi: 10.1186/s13244-022-01295-4. Insights Imaging. 2022. PMID: 36194373 Free PMC article. Review.
Cited by
-
Nerve abnormalities in lumbar disc herniation: A systematic review and meta-analysis of diffusion tensor imaging.PLoS One. 2022 Dec 27;17(12):e0279499. doi: 10.1371/journal.pone.0279499. eCollection 2022. PLoS One. 2022. PMID: 36574380 Free PMC article.
-
ADC-Based Stratification of Molecular Glioma Subtypes Using High b-Value Diffusion-Weighted Imaging.J Clin Med. 2021 Aug 4;10(16):3451. doi: 10.3390/jcm10163451. J Clin Med. 2021. PMID: 34441747 Free PMC article.
-
Automatic Histogram Specification for Glioma Grading Using Multicenter Data.J Healthc Eng. 2019 Dec 18;2019:9414937. doi: 10.1155/2019/9414937. eCollection 2019. J Healthc Eng. 2019. PMID: 31934325 Free PMC article.
-
Radiogenomics correlation between MR imaging features and mRNA-based subtypes in lower-grade glioma.BMC Neurol. 2020 Jun 29;20(1):259. doi: 10.1186/s12883-020-01838-6. BMC Neurol. 2020. PMID: 32600353 Free PMC article.
References
LinkOut - more resources
Full Text Sources
Other Literature Sources
Research Materials