

Changes in tumor oxygen state after sorafenib therapy evaluated by 18F-fluoromisonidazole hypoxia imaging of renal cell carcinoma xenografts
- PMID: 28781672
- PMCID: PMC5530133
- DOI: 10.3892/ol.2017.6371
Changes in tumor oxygen state after sorafenib therapy evaluated by 18F-fluoromisonidazole hypoxia imaging of renal cell carcinoma xenografts
Abstract
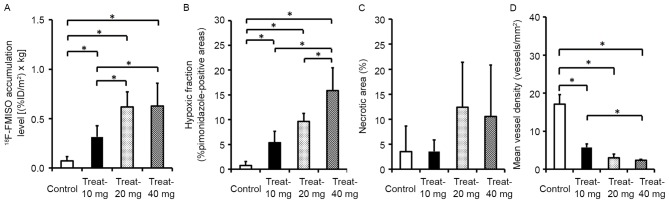
A mechanistic dissociation exists between tumor starvation and vascular normalization after antiangiogenic therapy. Thus, improved understanding of tumor responses (tumor starvation or vascular normalization) is important for optimizing treatment strategies. 18F-fluoromisonidazole (18F-FMISO) is widely used for imaging tumor hypoxia. To clarify the tumor response to the antiangiogenic drug sorafenib, the present study evaluated the changes in the tumor oxygen state using 18F-FMISO in mice bearing a renal cell carcinoma xenograft (A498). Mice bearing A498 xenografts were assigned to the control and three sorafenib-treatment groups and administered sorafenib (0, 10, 20 or 40 mg/kg/day, per os) once daily for 3 days. Following one day after the final administration, the mice were injected with 18F-FMISO and pimonidazole (a hypoxia marker). 18F-FMISO accumulation in the tumor was determined by autoradiography. Immunohistochemistry of pimonidazole and cluster of differentiation (CD)31 (a vascular marker) was also performed. 18F-FMISO accumulation levels in the tumor significantly increased by 4.3-, 8.4- and 8.6-fold compared with in the control group following 10, 20 and 40 mg/kg sorafenib treatments, respectively [0.07±0.04, 0.32±0.11, 0.62±0.15 and 0.63±0.23 (%ID/m2) × kg for the control, and 10, 20 and 40 mg treatments, respectively; all P<0.0083 vs. the control]. The number of pimonidazole-positive cells also significantly increased by 6.8-, 12.3- and 20.2-fold compared with in the control group following 10, 20 and 40 mg/kg sorafenib treatments, respectively (0.78±0.79, 5.36±2.29, 9.66±1.58 and 15.85±4.59% pimonidazole-positive cells; all P<0.0083 vs. the control). The number of microvessels in tumors markedly decreased to 33.5, 17.6, and 14.0% of the control following 10, 20 and 40 mg/kg sorafenib treatments, respectively (17.1±2.5, 5.7±1.0, 3.0±1.0 and 2.4±0.3 vessels/mm2; P<0.0083 vs. the control). The 18F-FMISO expression level in the tumor increased sorafenib-dose-dependently, which is consistent with the increase in the number of pimonidazole-positive cells and decrease in the number of microvessels. These findings indicated that the present sorafenib treatment protocol induces 'tumor hypoxia/starvation' in the renal cell carcinoma xenograft (A498) due to its antiangiogenic properties.
Keywords: 18F-fluoromisonidazole; antiangiogenic therapy; positron emission tomography; renal cell carcinoma; sorafenib; tumor hypoxia.
Figures


References
LinkOut - more resources
Full Text Sources
Other Literature Sources