

Effects of silver nanoparticles on nitrification and associated nitrous oxide production in aquatic environments
- PMID: 28782034
- PMCID: PMC5540255
- DOI: 10.1126/sciadv.1603229
Effects of silver nanoparticles on nitrification and associated nitrous oxide production in aquatic environments
Abstract
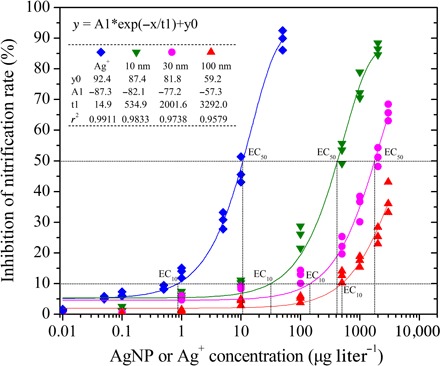
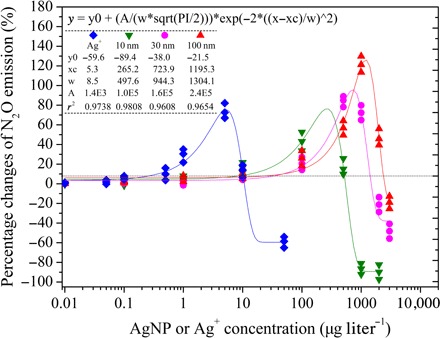
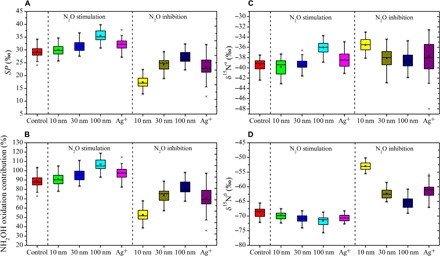
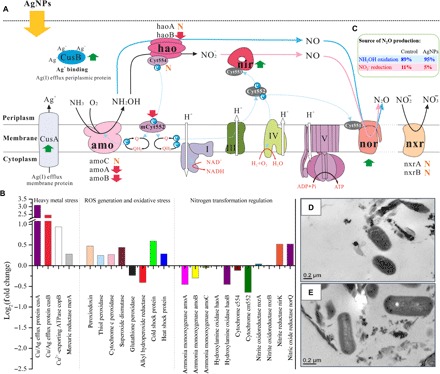
Silver nanoparticles (AgNPs) are the most common materials in nanotechnology-based consumer products globally. Because of the wide application of AgNPs, their potential environmental impact is currently a highly topical focus of concern. Nitrification is one of the processes in the nitrogen cycle most susceptible to AgNPs but the specific effects of AgNPs on nitrification in aquatic environments are not well understood. We report the influence of AgNPs on nitrification and associated nitrous oxide (N2O) production in estuarine sediments. AgNPs inhibited nitrification rates, which decreased exponentially with increasing AgNP concentrations. The response of nitrifier N2O production to AgNPs exhibited low-dose stimulation (<534, 1476, and 2473 μg liter-1 for 10-, 30-, and 100-nm AgNPs, respectively) and high-dose inhibition (hormesis effect). Compared with controls, N2O production could be enhanced by >100% at low doses of AgNPs. This result was confirmed by metatranscriptome studies showing up-regulation of nitric oxide reductase (norQ) gene expression in the low-dose treatment. Isotopomer analysis revealed that hydroxylamine oxidation was the main N2O production pathway, and its contribution to N2O emission was enhanced when exposed to low-dose AgNPs. This study highlights the molecular underpinnings of the effects of AgNPs on nitrification activity and demonstrates that the release of AgNPs into the environment should be controlled because they interfere with nitrifying communities and stimulate N2O emission.
Figures
Similar articles
-
Silver nanoparticles temporarily retard NO2 - production without significantly affecting N2 O release by Nitrosomonas europaea.Environ Toxicol Chem. 2015 Oct;34(10):2231-5. doi: 10.1002/etc.3071. Epub 2015 Sep 11. Environ Toxicol Chem. 2015. PMID: 26010547
-
Source identification of nitrous oxide on autotrophic partial nitrification in a granular sludge reactor.Water Res. 2013 Dec 1;47(19):7078-86. doi: 10.1016/j.watres.2013.07.055. Epub 2013 Oct 23. Water Res. 2013. PMID: 24200002
-
Mechanisms of N2O production in biological wastewater treatment under nitrifying and denitrifying conditions.Water Res. 2012 Mar 15;46(4):1027-37. doi: 10.1016/j.watres.2011.11.080. Epub 2011 Dec 8. Water Res. 2012. PMID: 22227243
-
Potential for biological nitrification inhibition to reduce nitrification and N2O emissions in pasture crop-livestock systems.Animal. 2013 Jun;7 Suppl 2:322-32. doi: 10.1017/S1751731113000761. Animal. 2013. PMID: 23739474 Review.
-
Microbial regulation of terrestrial nitrous oxide formation: understanding the biological pathways for prediction of emission rates.FEMS Microbiol Rev. 2015 Sep;39(5):729-49. doi: 10.1093/femsre/fuv021. Epub 2015 Apr 30. FEMS Microbiol Rev. 2015. PMID: 25934121 Review.
Cited by
-
Antioxidant Activity and Toxicity of Fullerenols via Bioluminescence Signaling: Role of Oxygen Substituents.Int J Mol Sci. 2019 May 10;20(9):2324. doi: 10.3390/ijms20092324. Int J Mol Sci. 2019. PMID: 31083407 Free PMC article.
-
Nanoparticle Exposure and Hormetic Dose-Responses: An Update.Int J Mol Sci. 2018 Mar 10;19(3):805. doi: 10.3390/ijms19030805. Int J Mol Sci. 2018. PMID: 29534471 Free PMC article. Review.
-
Effect of Ag Nanoparticles on Denitrification and Microbial Community in a Paddy Soil.Front Microbiol. 2021 Dec 22;12:785439. doi: 10.3389/fmicb.2021.785439. eCollection 2021. Front Microbiol. 2021. PMID: 35003016 Free PMC article.
-
A sandwich structure composite wound dressing with firmly anchored silver nanoparticles for severe burn wound healing in a porcine model.Regen Biomater. 2021 Aug 3;8(4):rbab037. doi: 10.1093/rb/rbab037. eCollection 2021 Aug. Regen Biomater. 2021. PMID: 34350029 Free PMC article.
-
Use of nanoparticles, a modern means of drug delivery, against cryptosporidiosis.J Adv Vet Anim Res. 2023 Dec 31;10(4):704-719. doi: 10.5455/javar.2023.j726. eCollection 2023 Dec. J Adv Vet Anim Res. 2023. PMID: 38370897 Free PMC article. Review.
References
-
- Maynard A. D., Aitken R. J., Butz T., Colvin V., Donaldson K., Oberdörster G., Philbert M. A., Ryan J., Seaton A., Stone V., Tinkle S. S., Tran L., Walker N. J., Warheit D. B., Safe handling of nanotechnology. Nature 444, 267–269 (2006). - PubMed
-
- Gao Y., Luo Z., He N., Wang M. K., Metallic nanoparticle production and consumption in China between 2000 and 2010 and associative aquatic environmental risk assessment. J. Nanopart. Res. 15, 1681–1690 (2013).
-
- Wiesner M. R., Lowry G. V., Alvarez P., Dionysiou D., Biswas P., Assessing the risks of manufactured nanomaterials. Environ. Sci. Technol. 40, 4336–4345 (2006). - PubMed
-
- Yang Y., Li M., Michels C., Moreira-Soares H., Alvarez P. J. J., Differential sensitivity of nitrifying bacteria to silver nanoparticles in activated sludge. Environ. Toxicol. Chem. 33, 2234–2239 (2014). - PubMed
-
- Massarsky A., Trudeau V. L., Moon T. W., Predicting the environmental impact of nanosilver. Environ. Toxicol. Phar. 38, 861–873 (2014). - PubMed
Publication types
LinkOut - more resources
Full Text Sources
Other Literature Sources
