. 2017 Dec 15;595(24):7451-7475.
doi: 10.1113/JP274475. Epub 2017 Sep 2.

Detection of phasic dopamine by D1 and D2 striatal medium spiny neurons

Affiliations

Detection of phasic dopamine by D1 and D2 striatal medium spiny neurons

Cedric Yapo et al. J Physiol. .

Abstract

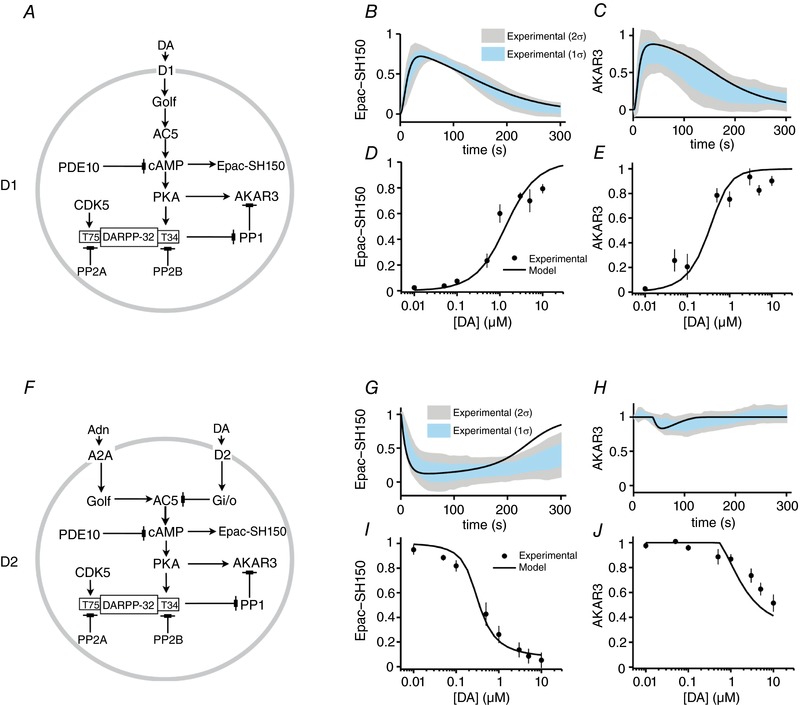
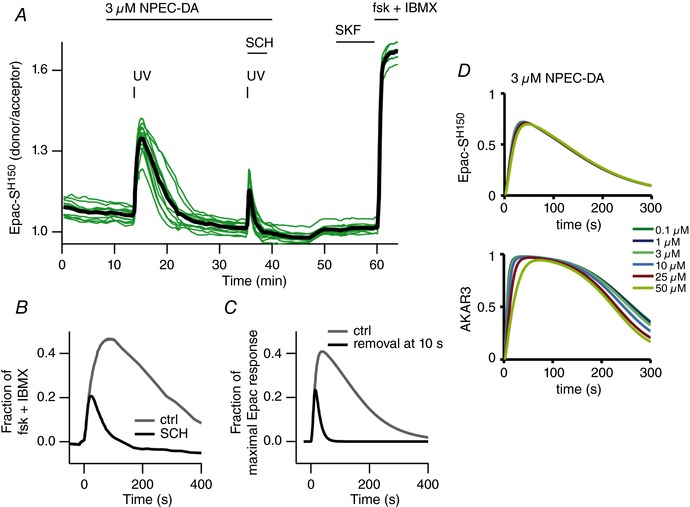
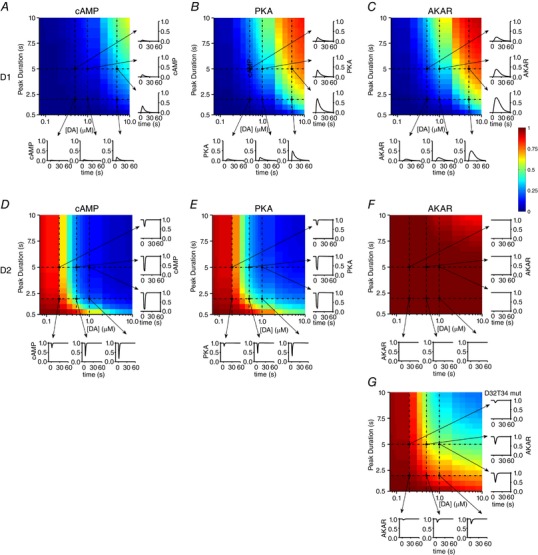
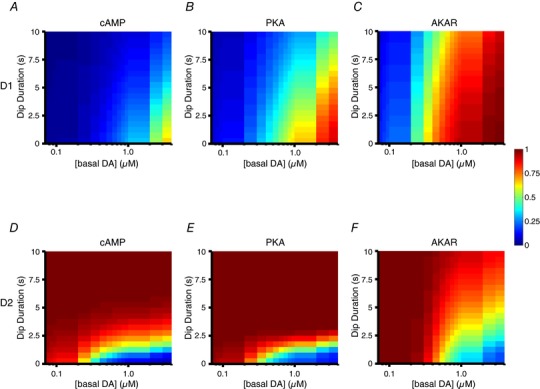
Key points: Brief dopamine events are critical actors of reward-mediated learning in the striatum; the intracellular cAMP-protein kinase A (PKA) response of striatal medium spiny neurons to such events was studied dynamically using a combination of biosensor imaging in mouse brain slices and in silico simulations. Both D1 and D2 medium spiny neurons can sense brief dopamine transients in the sub-micromolar range. While dopamine transients profoundly change cAMP levels in both types of medium spiny neurons, the PKA-dependent phosphorylation level remains unaffected in D2 neurons. At the level of PKA-dependent phosphorylation, D2 unresponsiveness depends on protein phosphatase-1 (PP1) inhibition by DARPP-32. Simulations suggest that D2 medium spiny neurons could detect transient dips in dopamine level.

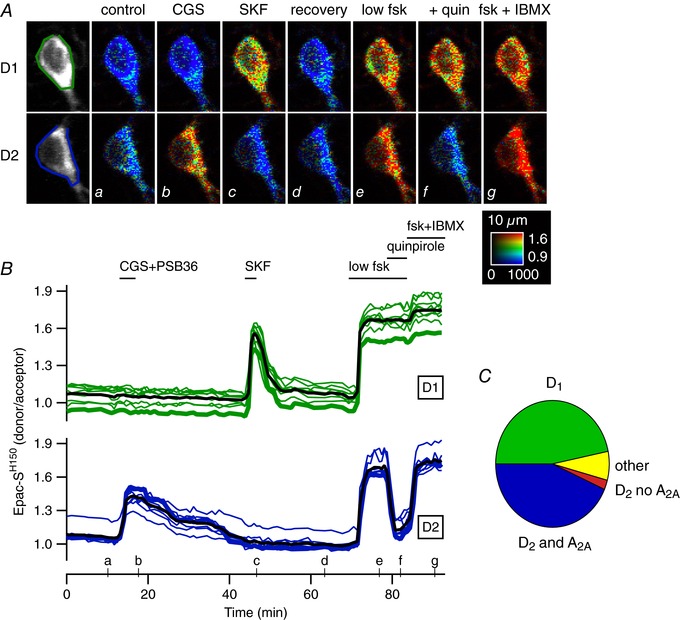
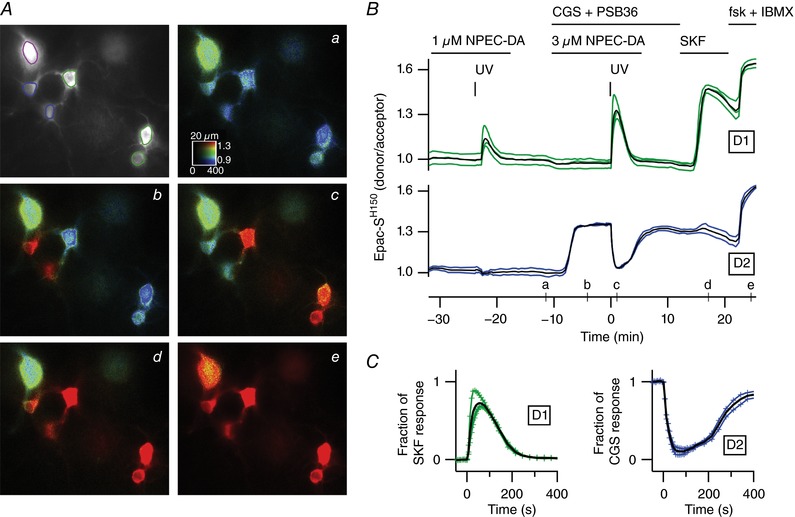
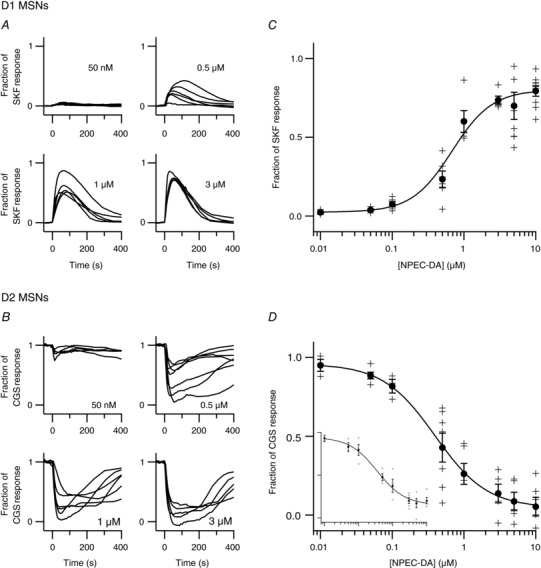
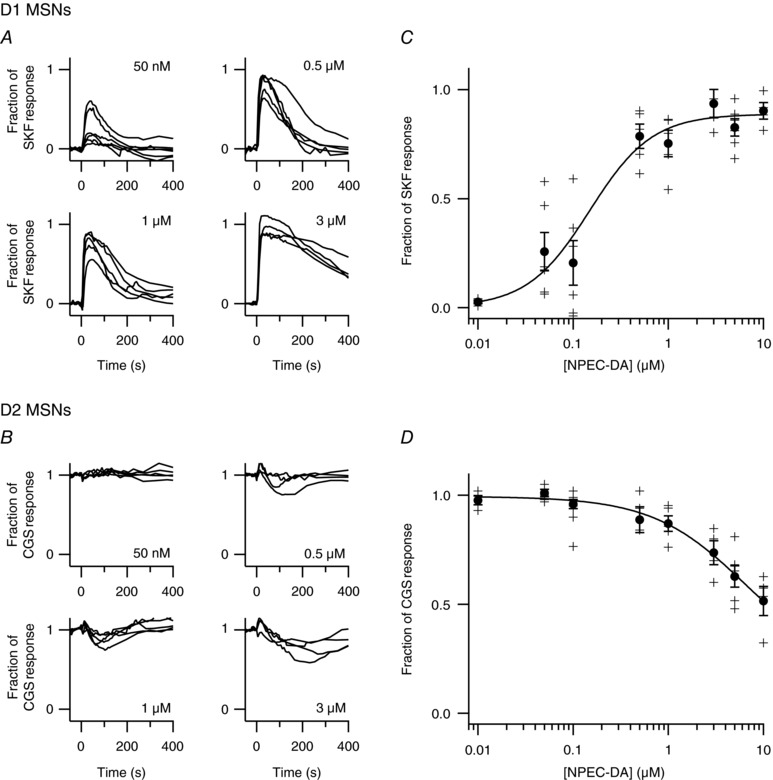
Abstract: The phasic release of dopamine in the striatum determines various aspects of reward and action selection, but the dynamics of the dopamine effect on intracellular signalling remains poorly understood. We used genetically encoded FRET biosensors in striatal brain slices to quantify the effect of transient dopamine on cAMP or PKA-dependent phosphorylation levels, and computational modelling to further explore the dynamics of this signalling pathway. Medium-sized spiny neurons (MSNs), which express either D1 or D2 dopamine receptors, responded to dopamine by an increase or a decrease in cAMP, respectively. Transient dopamine showed similar sub-micromolar efficacies on cAMP in both D1 and D2 MSNs, thus challenging the commonly accepted notion that dopamine efficacy is much higher on D2 than on D1 receptors. However, in D2 MSNs, the large decrease in cAMP level triggered by transient dopamine did not translate to a decrease in PKA-dependent phosphorylation level, owing to the efficient inhibition of protein phosphatase 1 by DARPP-32. Simulations further suggested that D2 MSNs can also operate in a 'tone-sensing' mode, allowing them to detect transient dips in basal dopamine. Overall, our results show that D2 MSNs may sense much more complex patterns of dopamine than previously thought.

Keywords: biosensor imaging; dopamine; intracellular second messengers.


Figures

Figure 1
Figure 1. D1 and A2A/D2 responses are segregated in two main types of neurons in the dorsal striatum
A, two representative D1 and D2 MSNs (out of 21) in a brain slice expressing the cAMP biosensor Epac‐SH150, imaged with two‐photon microscopy: raw fluorescence of the donor is displayed in grey and donor/acceptor fluorescence ratio is displayed in pseudo‐colour. Images ag show the ratio corresponding to the time points indicated on the graph below in B. B, each trace indicates the emission ratio measured on the cell body of individual neurons. Traces are grouped on the basis of their similar response pattern. Thick traces correspond to the two cells illustrated in A. Black traces represent the average response. Bath application of the adenosine A2A agonist CGS 21680 (1 μm), in the presence of the antagonist of A1 receptors PSB36 (0.1 μm), revealed which MSNs express A2A receptors (blue traces). Bath application of SKF‐81297 (SKF, 100 nm) revealed MSNs which express D1‐like receptors (green traces). A low dose of forskolin (low fsk, 0.5 μm) increased cAMP in all MSNs. Addition of the D2‐like agonist quinpirole (1 μm) decreased cAMP in the neurons which also responded to A2A agonist. The final application of forskolin (to activate adenylyl cyclases, fsk, 13 μm) and IBMX (to inhibit phosphodiesterases, 200 μm) showed the maximal ratio response for each neuron. The calibration square indicates from left to right increasing intensity levels, from bottom to top increasing ratio values, i.e. increasing intracellular cAMP concentration. The size of the square is 10 μm. C, 205 neurons from 6 similar experiments sorted into 4 categories: neurons responding to SKF (D1 MSNs), neurons responding to both CGS and quinpirole (D2 MSNs; D2 and A2A), neurons responding only to quinpirole (D2 no A2A), and neurons responding to nothing except the final fsk+IBMX (others).
Figure 2
Figure 2. Transient dopamine induces positive and negative cAMP responses in D1 and D2 MSNs, respectively
A, wide‐field imaging of the cAMP biosensor Epac‐SH150 in the dorsal striatum. Raw fluorescence of the donor is displayed in grey and donor/acceptor fluorescence ratio is displayed in pseudo‐colour. Images ae show the ratio corresponding to the time points indicated on the graph in B. The large neuron (purple contour, top left) is a putative giant cholinergic interneuron. B, dopamine released from NPEC‐DA (1 μm) by UV uncaging generated a transient positive response in the D1 MSNs (green traces), and no effect on basal cAMP levels in D2 MSNs (blue traces). During the steady‐state response to the A2A receptor agonist CGS 21680 (CGS, 1 μm) in D2 MSNs, uncaging (test dose of 3 μm NPEC‐DA) generated a second transient increase in the D1 MSNs, and a trough in the D2 MSNs. The D1 receptor agonist SKF‐81297 (SKF, 100 nm) was applied at the end of the experiment to determine the maximal D1 response. The final application of forskolin (fsk, 13 μm) and IBMX (200 μm) revealed the saturating ratio level for each neuron. The A1 receptor antagonist PSB36 (100 nm) was applied together with CGS 21680. C, the traces of these individual cells and their average ratio responses in the D1 or D2 MSNs are normalized with respect to the maximal D1 and A2A responses produced by SKF‐81297 or CGS 21680, respectively. Black traces in B and C represent the averages.
Figure 3
Figure 3. Transient dopamine regulates cAMP in D1 and D2 MSNs in a dose‐dependent manner
The experiment presented in Fig. 2 was repeated with different doses of NPEC‐DA (a single dose per experiment) in brain slices expressing the Epac‐SH150 biosensor. Each trace represents the average response to dopamine uncaging for D1 MSNs (A) or D2 MSNs (B) in one brain slice. C, for D1 MSNs, the amplitude of the cAMP responses was normalized with respect to the response to SKF‐81297 (100 nm); EC50 was 0.68 μm. D, for D2 MSNs, responses were normalized to the level reached with CGS 21680 (1 μm) before uncaging; EC50 was 0.39 μm. Inset (same units), a similar dose–response analysis was performed except that a low concentration of forskolin (63 nm) was used to increase cAMP to a steady‐state level in D2 MSNs; EC50 was 0.35 μm.
Figure 4
Figure 4. Effect of transient dopamine on PKA‐dependent phosphorylation in D1 and D2 MSNs
Similar experiments as in Fig. 3 were performed with the PKA biosensor AKAR3. Each trace represents the average response to dopamine uncaging for D1 MSNs (A) or D2 MSNs (B) in one brain slice. For D1 MSNs, AKAR3 responses were normalized with respect to the response to SKF‐81297 (100 nm); for D2 MSNs, responses were normalized to the level reached with CGS 21680 (1 μm) before uncaging. The maximal value of the transient AKAR3 response was used to build a dose–response curve for D1 MSNs (C) and D2 MSNs (D). Fitting the data to a Hill equation gives an EC50 of 0.15 μm for D1 MSNs.
Figure 5
Figure 5. Modelled D1 and D2 MSN signalling network and fitting to experimental data
A, modelled signalling network for dopamine‐dependent signalling in D1 MSN. B and C, comparison of D1 MSN model simulation and measured response at the level of Epac‐SH150 in response to uncaging of 3 μm dopamine (B) and at the level of AKAR3 phosphorylation in response to uncaging of 1 μm dopamine (C). The shaded regions indicate the first and second standard deviations of the measured responses. Dopamine uncaging is simulated using an instantaneous increase in DA concentration to a given amplitude followed by an exponential decay (see Methods). D and E, comparison of the simulated and measured Epac‐SH150 (D) and AKAR3 (E) responses with varying concentrations of uncaged dopamine. F, modelled signalling network for dopamine‐dependent signalling in D2 MSN. The signalling core is the same as in D1 model except for the receptors. G and H, comparison of D2 model simulation and measured response at the level of Epac‐SH150 in response to uncaging of 3 μm dopamine (G) and at the level of AKAR3 phosphorylation in response to uncaging of 1 μm dopamine (H). I and J, comparison of dopamine dose‐dependent response between D2 model simulations and measurement at the level of Epac‐SH150 (I) and AKAR3 (J). [Color figure can be viewed at wileyonlinelibrary.com]
Figure 6
Figure 6. Dopamine remains in the brain slice for minutes after uncaging
A, a brain slice expressing the Epac‐SH150 biosensor was imaged with wide‐field microscopy. A first uncaging of NPEC‐DA (3 μm) was performed to produce a control cAMP response in D1 MSNs. After recovery, a second similar uncaging was performed, while the D1 antagonist SCH‐23390 (SCH, 1 μm) was applied at the same time with a fast perfusion system. In the presence of SCH‐23390, the cAMP response appeared of smaller amplitude and duration. Subsequent application of SKF‐81297 (SKF, 100 nm) showed no effect because D1 receptors were still blocked by SCH‐23390. B, overlaid traces of the two uncaging episodes shown in A. In this experiment, while the effect of UV uncaging is instantaneous, diffusion of the antagonist from the surface of the slice to the in‐depth imaged neurons requires an additional diffusion time. SCH‐23390 was thus able to shorten the response to dopamine uncaging, indicating that dopamine is still activating D1 receptors minutes after having been released in the brain slice. C, the same experiment was simulated, with control uncaging and with dopamine being removed 10 s after release. D, biosensor concentration has little effect on response amplitude. Simulations using the D1 MSN model with different concentrations of the Epac‐SH150 or AKAR3 biosensors, and dopamine stimuli mimicking the dopamine uncaging experiment. The dopamine stimulus corresponds to an instantaneous increase in dopamine concentration to the indicated concentration with an exponential decay with a 90 s time constant (see Methods). Differences in logged responses became significant only for biosensor concentrations of 50 μm and above. [Color figure can be viewed at wileyonlinelibrary.com]
Figure 7
Figure 7. Simulations of D1 and D2 MSN models with brief dopamine transients
Responses at the level of cAMP (A), PKA (B) and AKAR (C) for the D1 MSN model simulations with different amplitude and duration of dopamine input. Each heat map represents the maximal value of the response produced by dopamine input of the indicated amplitude and duration. Colours correspond to the shown colour bar. The response values are normalized between 0 and 1, where 0 corresponds to the response in absence of any receptor stimulation and 1 corresponds to the response produced by saturating activation of D1 receptor. The traces show the time course of the responses for selected dopamine input levels (0.5 μm, 1.0 μm and 5.0 μm) and durations (2 s and 5 s). Responses at the level of cAMP (D), PKA (E) and AKAR (F) for the D2 MSN model simulations with different amplitude and duration of dopamine input. G, same as F, except that DARPP‐32 bears a Thr34 lack‐of‐function mutation. The heat map represents the minimal value of the response produced by dopamine input. The response values are normalized between 0 and 1, where 0 corresponds to the response in absence of any receptor stimulation and 1 corresponds to the response produced by the activation of ∼50% of A2A receptor. The traces show the time course of the response for selected dopamine input level (0.2 μm, 0.5 μm and 1.0 μm) and duration (2 s and 5 s).
Figure 8
Figure 8. Simulations of D1 and D2 MSN models with varying levels of tonic dopamine and dips in this tone level
Responses at the level of cAMP (A), PKA (B) and AKAR (C) for the D1 MSN model simulations with varying basal (tonic) dopamine levels (upper 1D heat map) and the effect of a dopamine dip (lower 2D heat map) in these different basal level conditions. Each heat map represents the maximal value of the response produced by the dopamine dip. Colours correspond to the shown colour bar. The response values are normalized between 0 and 1, where 0 corresponds to the minimal response in the absence of any receptor stimulation and 1 corresponds to the response produced by a maximal activation of the D1 receptor. The relation between basal response and tonic dopamine level is displayed as a heat map using the same colour map as the dip response in order to facilitate comparison between the basal response and the effect of dip on top of that. Responses at the level of cAMP (D), PKA (E) and AKAR (F) for the D2 MSN model simulations with varying basal dopamine levels (upper 1D heat map) and the effect of a dopamine dip (lower 2D heat map) in these different basal level condition. In this case, the heat map represents the minimal value of response. The response values are normalized, 0 corresponding to the minimal response in absence of any receptor stimulation and 1 corresponding to the maximal response produced by the activation of ∼50% of A2A receptor.

Comment in

  • Striatal neurons get a kick out of dopamine.
    Madsen KL, Dreyer JK. Madsen KL, et al. J Physiol. 2017 Dec 15;595(24):7271-7272. doi: 10.1113/JP275079. Epub 2017 Nov 19. J Physiol. 2017. PMID: 29105113 Free PMC article. No abstract available.

References

    1. Ahn JH, McAvoy T, Rakhilin SV, Nishi A, Greengard P & Nairn AC (2007a). Protein kinase A activates protein phosphatase 2A by phosphorylation of the B56delta subunit. Proc Natl Acad Sci USA 104, 2979–2984. - PMC - PubMed
    1. Ahn JH, Sung JY, McAvoy T, Nishi A, Janssens V, Goris J, Greengard P & Nairn AC (2007b). The B’’/PR72 subunit mediates Ca2+‐dependent dephosphorylation of DARPP‐32 by protein phosphatase 2A. Proc Natl Acad Sci USA 104, 9876–9881. - PMC - PubMed
    1. Albert PR, Neve KA, Bunzow JR & Civelli O (1990). Coupling of a cloned rat dopamine‐D2 receptor to inhibition of adenylyl cyclase and prolactin secretion. J Biol Chem 265, 2098–2104. - PubMed
    1. Allen MD & Zhang J (2006). Subcellular dynamics of protein kinase A activity visualized by FRET‐based reporters. Biochem Biophys Res Commun 348, 716–721. - PubMed
    1. Arbuthnott GW & Wickens J (2007). Space, time and dopamine. Trends Neurosci 30, 62–69. - PubMed

Publication types

MeSH terms