. 2018 Apr;141(4):1427-1438.
doi: 10.1016/j.jaci.2017.06.042. Epub 2017 Aug 4.

Plasma cell deficiency in human subjects with heterozygous mutations in Sec61 translocon alpha 1 subunit (SEC61A1)

Affiliations

Plasma cell deficiency in human subjects with heterozygous mutations in Sec61 translocon alpha 1 subunit (SEC61A1)

Desirée Schubert et al. J Allergy Clin Immunol. 2018 Apr.

Abstract

Background: Primary antibody deficiencies (PADs) are the most frequent primary immunodeficiencies in human subjects. The genetic causes of PADs are largely unknown. Sec61 translocon alpha 1 subunit (SEC61A1) is the major subunit of the Sec61 complex, which is the main polypeptide-conducting channel in the endoplasmic reticulum membrane. SEC61A1 is a target gene of spliced X-box binding protein 1 and strongly induced during plasma cell (PC) differentiation.

Objective: We identified a novel genetic defect and studied its pathologic mechanism in 11 patients from 2 unrelated families with PADs.

Methods: Whole-exome and targeted sequencing were conducted to identify novel genetic mutations. Functional studies were carried out ex vivo in primary cells of patients and in vitro in different cell lines to assess the effect of SEC61A1 mutations on B-cell differentiation and survival.

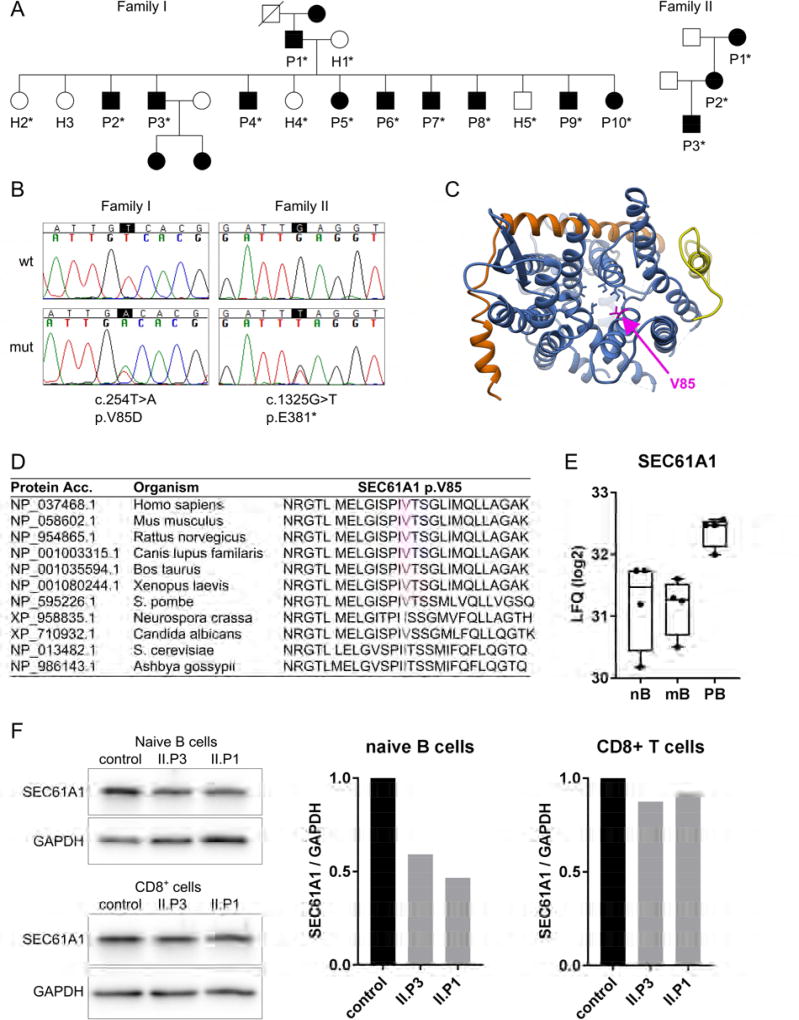
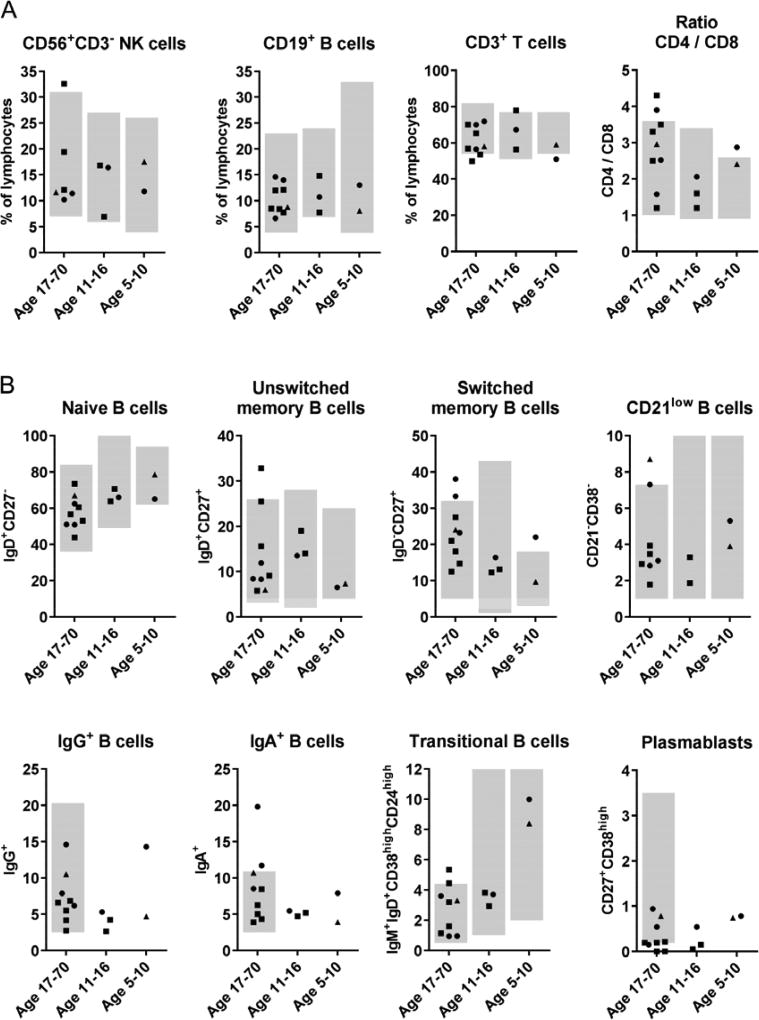
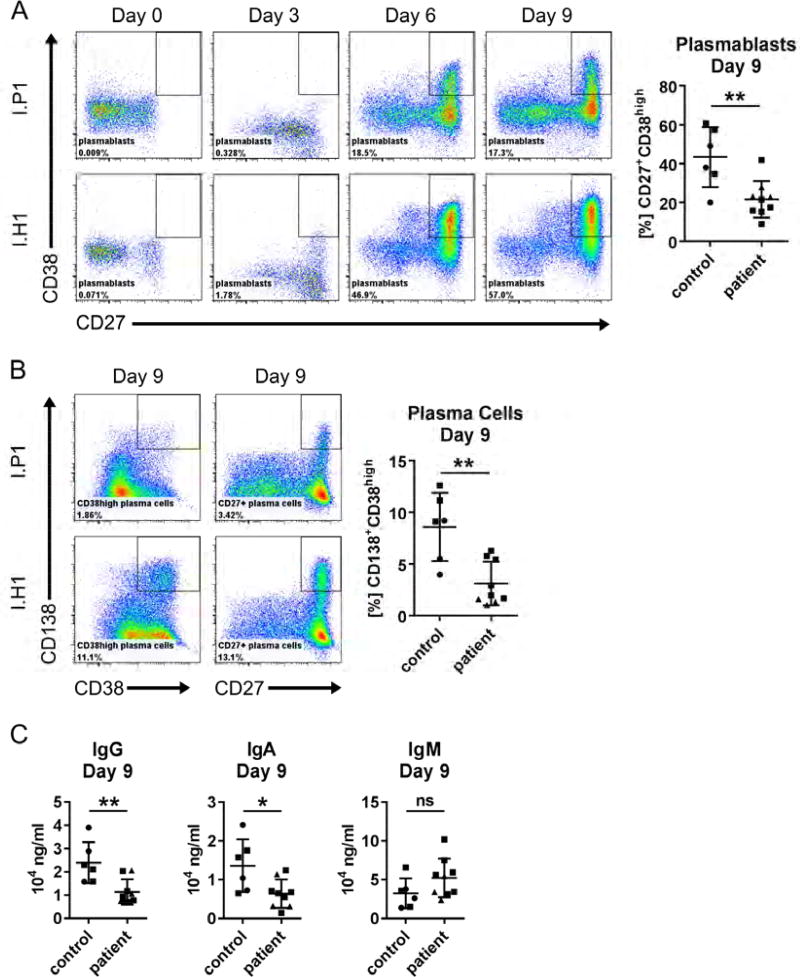
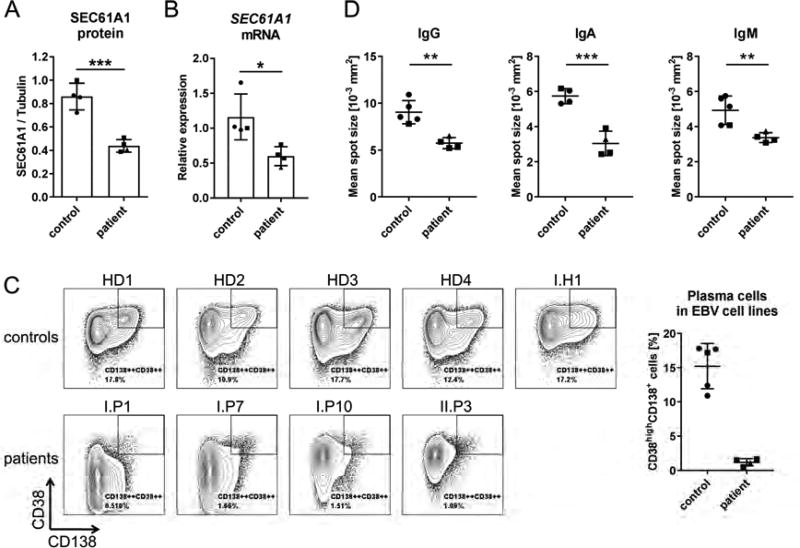
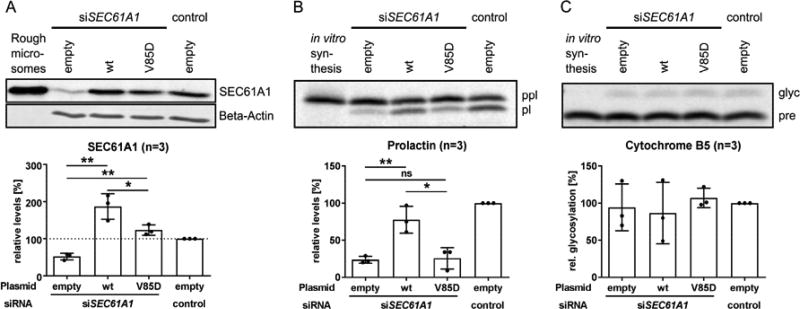
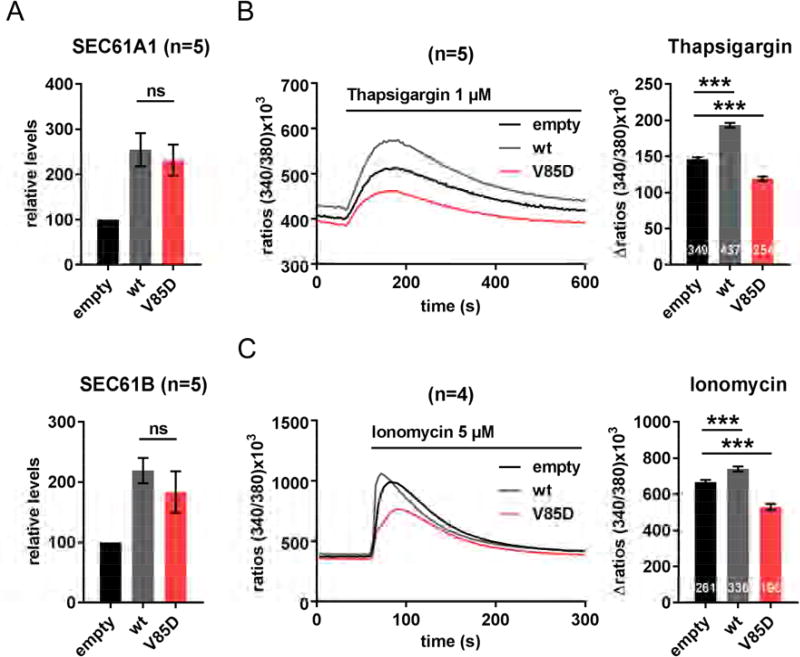
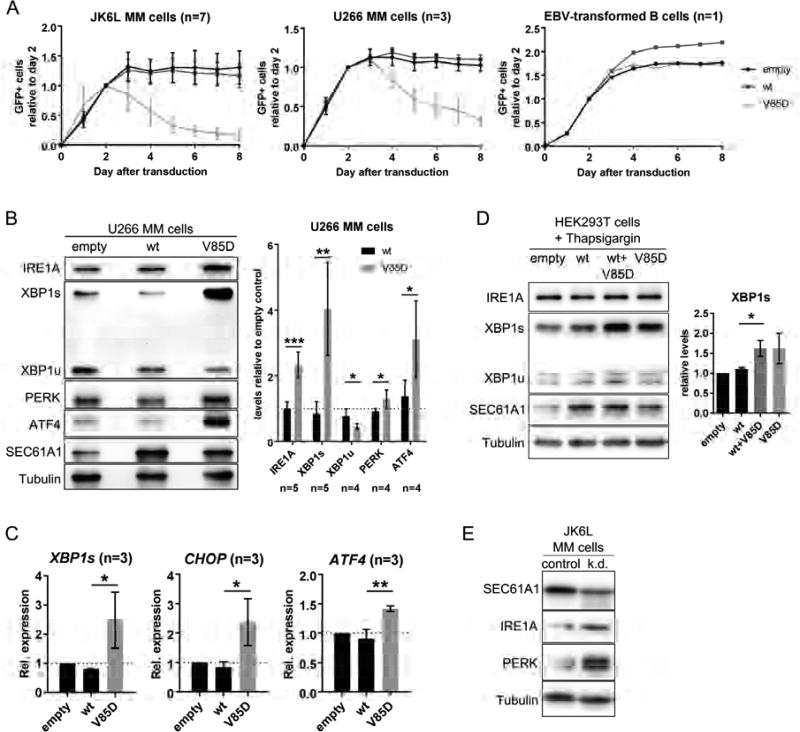
Results: We investigated 2 families with patients with hypogammaglobulinemia, severe recurrent respiratory tract infections, and normal peripheral B- and T-cell subpopulations. On in vitro stimulation, B cells showed an intrinsic deficiency to develop into PCs. Genetic analysis and targeted sequencing identified novel heterozygous missense (c.254T>A, p.V85D) and nonsense (c.1325G>T, p.E381*) mutations in SEC61A1, segregating with the disease phenotype. SEC61A1-V85D was deficient in cotranslational protein translocation, and it disturbed the cellular calcium homeostasis in HeLa cells. Moreover, SEC61A1-V85D triggered the terminal unfolded protein response in multiple myeloma cell lines.

Conclusion: We describe a monogenic defect leading to a specific PC deficiency in human subjects, expanding our knowledge about the pathogenesis of antibody deficiencies.

Keywords: SEC61A1; antibody deficiency; calcium homeostasis; endoplasmic reticulum stress; multiple myeloma; plasma cell; protein translocation; translocon.


Figures

Figure 1
Figure 1. Mutations in SEC61A1 in patients with hypogammaglobulinemia
A: Pedigrees of two families with germline SEC61A1 mutations. Squares: males; circles: females; black filled symbols: mutation carriers; asterisk: genetically tested. B: Confirmation of mutations by Sanger sequencing showing the heterozygous changes in the coding sequence (c) and the protein sequence (p). Wt: wild type; mut: mutant. C: Atomic model of the heterotrimeric Sec61 complex in the laterally closed conformation seen from the cytoplasm, composed of SEC61A1 (blue), SEC61B (orange) and SEC61G (yellow). Pore ring residues in the center of the channel are shown in blue with the mutated V85 in magenta. The plug domain (transparent) reaches into the pore from the back. D: Protein sequence alignment of SEC61A1 from various species including vertebrates and fungi. The mutated V85 is highlighted in magenta. E: Log2 of label free quantitation (LFQ) values of SEC61A1 as determined by mass spectrometry-based proteomics in human cells sorted from peripheral blood. Data were taken from Rieckmann et al.. nB: naïve B cells; mB: memory B cells; PB: plasmablasts F: Western blot analysis of SEC61A1 levels in sorted primary CD19+CD27 naïve B cells and CD3+CD4 T cells. Bar graphs show the quantification of the blots with SEC61A1 normalized to GAPDH levels.
Figure 2
Figure 2. Flow cytometric analysis of PBMCs
Relative amount of indicated cells among peripheral blood lymphocytes (A) or among CD19+ B cells (B) of patients from Family I (squares), Family II (triangles) and travel controls (circles) divided in three age groups. Grey background indicates the normal range for each age group.
Figure 3
Figure 3. In vitro differentiation of primary B cells into plasma cells upon stimulation with CD40L and IL21
Scatter plots summarize results of independent experiments for travel controls (circles) and patients of Family I (squares) and Family II (triangles). A: Representative flow cytometry plots showing CD38highCD27+ plasmablasts among CD19+ primary B cells. B: Representative flow cytometry plots showing CD38highCD138+ and CD27+CD138+ plasma cells among CD19+ primary B cells. C: Ig in the cell culture supernatant measured by ELISA upon CD40L/IL21 stimulation at Day 9. Data are represented as mean ± SD; **p<0.005, *p<0.05, ns: not significant (unpaired t test).
Figure 4
Figure 4. Analysis of the phenotype of EBV-transformed B cell lines SEC61A1 mutation carriers
Data are shown for subjects of Family I (squares), Family II (triangles) and unrelated healthy donors (HD) (circles). A: Quantification of Western blot analysis of SEC61A1 relative to tubulin levels in four HD EBV cell lines and four cell lines from different patients. (n=2) B: SEC61A1 mRNA levels relative to the reference genes HPRT, TBP, RPLP0 in EBV cell lines from (A). (n=1) C: Flow cytometric analysis of surface marker expression in five HD and four patient EBV cell lines. The bar graph indicates the frequency of CD38highCD138+ cells per cell line. D: ELISPOT analysis of the mean spot size of secreted IgG, IgA and IgM. Data in bar graphs are represented as mean ± SD, ns: not significant, *p<0.05, **p<0.005, ***p<0.001 (unpaired t test).
Figure 5
Figure 5. Effect of p.V85D on Sec61 complex-dependent co-translational protein translocation into the ER
A: Representative Western blot and respective quantification of SEC61A1 levels in HeLa cells treated with the indicated siRNA and transiently transfected with the indicated plasmids. B: Representative phosphorimaging blot and respective quantification of the efficiency of co-translational transport of pre-prolactin (ppl) into the ER by HeLa cells given as relative percentage of mature, processed protein prolactin (pl). C: Representative phosphorimaging blot (n=3) of the efficiency of Sec61 complex-independent post-translational transport of pre-Cytochrome B5 (pre) into the ER (in HeLa cells) given as the relative percentage of mature, glycosylated protein (glyc). Data are represented as mean ± SD; ns: not significant, *p<0.05, **p<0.005 (unpaired t test).
Figure 6
Figure 6. Effect of SEC61A1-V85D on Ca2+ leakage from the ER into the cytosol
A: Protein levels of SEC61A1 and SEC61B two days after transient transfection of HeLa cells relative to endogenous levels. Data (n=5) represented as mean ± SEM, ns: not significant (unpaired t-test). B: Thapsigargin-treatment and live cell imaging of calcium-indicator (Fura-2) loaded in HeLa cells overproducing SEC61A1 (n=5). C: Ionomycin-treatment and live cell imaging of calcium-indicator (Fura-2) loaded in HeLa cells overproducing SEC61A1 (n=4). B and C: Data in bar graphs represented as mean ± SEM with the total number of analyzed cells shown at the bottom of the bars. ***p<0.001 (unpaired t test).
Figure 7
Figure 7. Effect of UPR induction on plasma cells and sensitized Hek293T cells after SEC61A1-V85D overproduction
A: Flow cytometric analysis of the indicated cell lines after stable transduction with an expression vector encoding SEC61A1-wt or -V85D and GFP separated by an IRES site. B: Representative Western blots and respective statistical analysis showing levels of the indicated proteins in U266 cells stably overexpressing SEC61A1-wt and -V85D normalized to tubulin levels and relative to cells transduced with the empty vector. C: Relative mRNA expression of the indicated transcription factors in L363 cells stably overexpressing SEC61A1-wt or -V85D. D: Representative Western blots showing levels of the indicated proteins in Thapsigargin-treated Hek293T cells stably overexpressing SEC61A1-wt and/or -V85D (n=4). The bar graph shows the respective statistical analysis of XBP1s levels normalized to tubulin levels and relative to cells transduced with the empty vector. E: Western blot (n=1) showing levels of indicated proteins in JK6L cells treated for 24 hours with siRNA against SEC61A1. Data in bar graphs is represented as mean ± SD, ns: not significant, *p<0.05, **p<0.005, ***p<0.001 (unpaired t test).

Comment in

References

    1. Picard C, Al-Herz W, Bousfiha A, Casanova JL, Chatila T, Conley ME, et al. Primary Immunodeficiency Diseases: an Update on the Classification from the International Union of Immunological Societies Expert Committee for Primary Immunodeficiency 2015. J Clin Immunol. 2015;35:696–726. - PMC - PubMed
    1. Fried AJ, Bonilla FA. Pathogenesis, diagnosis, and management of primary antibody deficiencies and infections. Clin Microbiol Rev. 2009;22:396–414. - PMC - PubMed
    1. Wiest DL, Burkhardt JK, Hester S, Hortsch M, Meyer DI, Argon Y. Membrane biogenesis during B cell differentiation: most endoplasmic reticulum proteins are expressed coordinately. J Cell Biol. 1990;110:1501–11. - PMC - PubMed
    1. Cenci S, Sitia R. Managing and exploiting stress in the antibody factory. FEBS Lett. 2007;581:3652–7. - PubMed
    1. Cox JS, Walter P. A novel mechanism for regulating activity of a transcription factor that controls the unfolded protein response. Cell. 1996;87:391–404. - PubMed

Publication types

MeSH terms