. 2017 Sep;49(9):1319-1325.
doi: 10.1038/ng.3931. Epub 2017 Aug 7.

Classification of common human diseases derived from shared genetic and environmental determinants

Affiliations

Classification of common human diseases derived from shared genetic and environmental determinants

Kanix Wang et al. Nat Genet. 2017 Sep.

Abstract

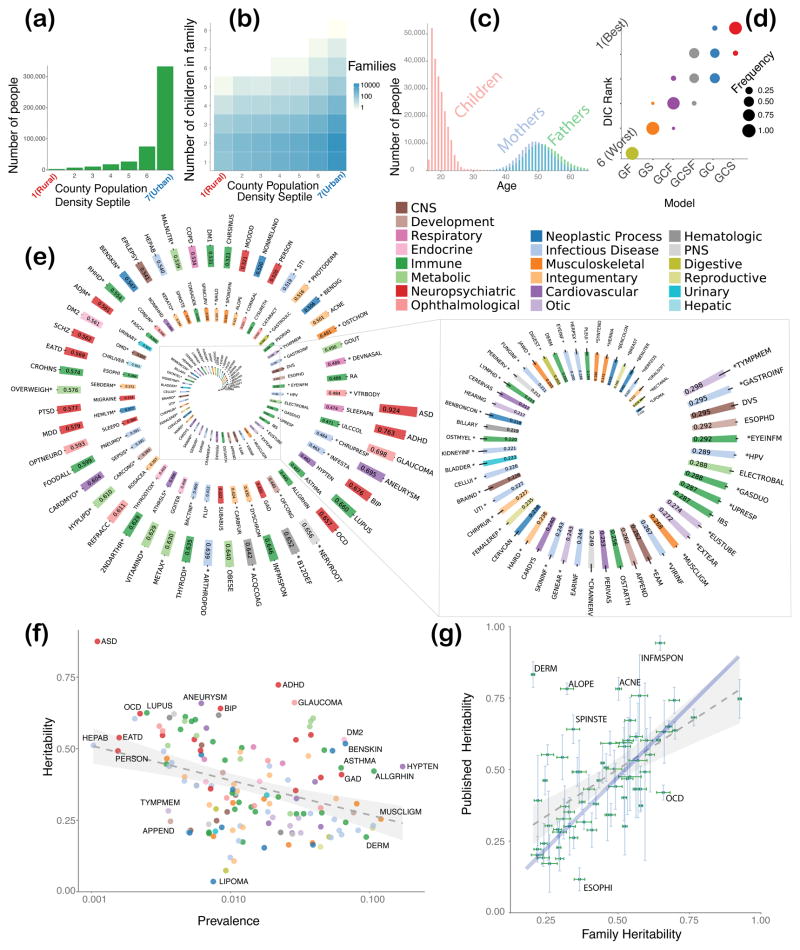
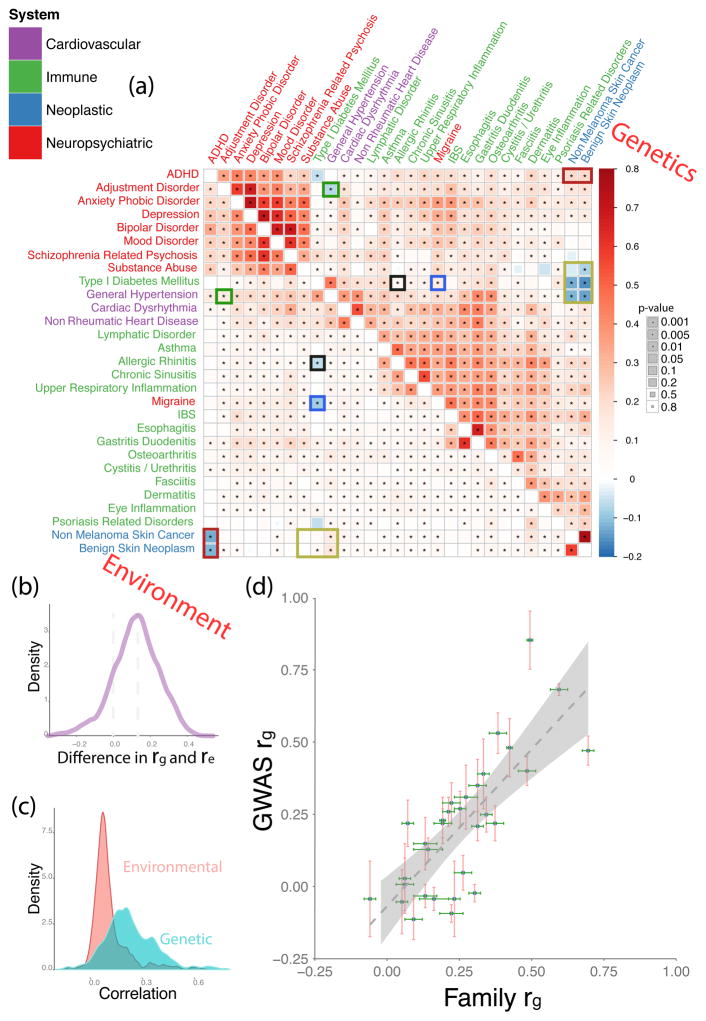
In this study, we used insurance claims for over one-third of the entire US population to create a subset of 128,989 families (481,657 unique individuals). We then used these data to (i) estimate the heritability and familial environmental patterns of 149 diseases and (ii) infer the genetic and environmental correlations for disease pairs from a set of 29 complex diseases. The majority (52 of 65) of our study's heritability estimates matched earlier reports, and 84 of our estimates appear to have been obtained for the first time. We used correlation matrices to compute environmental and genetic disease classifications and corresponding reliability measures. Among unexpected observations, we found that migraine, typically classified as a disease of the central nervous system, appeared to be most genetically similar to irritable bowel syndrome and most environmentally similar to cystitis and urethritis, all of which are inflammatory diseases.


Conflict of interest statement

Competing Financial Interests Statement

The authors declare no competing financial interests.

Figures

Figure 1
Figure 1
Information on study population, results of model selection, and analysis of heritability of 149 diseases. (A) Distribution of study population across population density septile; septile 1 corresponds to the most-rural counties and septile 7 most-urban. (B) Number of children in a family as a function of population density septile; septile notations are the same as in the (A). (C) Parent/child age distribution in studied families. (D) Model selection results, using univariate models GF, GS, GCF, GCSF, GC, and GCS, where G stands for additive genetics, F for common family environment, S for common sibling environment, and C for environment common for parental couple; plot shows frequency of corresponding model becoming the “best” (rank 1) as compared by DIC, second best (rank 2), and so on; clearly, the GCS model wins in the majority of cases. (E) Disease heritability estimates with one standard deviation; diseases, heritability for which appears to be measured for the first time are marked with asterisk; heritability values are sorted in decreasing order; color of the bar indicates biological system associated with the disease, see key in the upper right corner; keys to disease acronyms are given in the Supplementary Table 1 and 2. (F) Estimates of disease heritability values against estimates of disease prevalence; the linear correlation is significantly negative, Pearson’s r = −0.212 (95% CI [−0.36 −0.05]), and p = 0.00915. (G) Comparison of our estimates of heritability with the previously published estimates; see Supplement Table 3 for detailed numbers.
Figure 2
Figure 2
Genetic and environmental correlations between diseases. (A) Matrix of pairwise genetic correlations (upper half) and corresponding environmental interactions (lower half) colored by sign and magnitude (see legend) The disease color labels indicate biological systems associated; the size of the squares indicates statistical significance, see key on the right. Cells with asterisks indicate pairwise interactions that remained significant at a false discovery rate of 1%. The color boxes within the matrix indicate opposite-sign correlation values for the same pair of diseases. Posterior probabilities of two correlation values (genetic and environmental) for the same pair of diseases having the same sign were 1.869 × 10⁻¹⁴ (ADHD and benign skin neoplasm), 3.376 × 10⁻¹⁴ (ADHD and non-melanoma skin cancer), 4.523 × 10⁻⁹ (adjustment disorder and general hypertension), 8.715 × 10⁻⁴ (migraine and type 1 diabetes mellitus), 9.251 × 10⁻⁵ (benign skin neoplasm and type 1 diabetes mellitus), 6.401 × 10⁻³³ (benign skin neoplasm and general hypertension), 3.712 × 10⁻¹⁷ (non-melanoma skin cancer and general hypertension), 3.933 × 10⁻⁴ (allergic rhinitis and type 1 diabetes mellitus). (B) Distribution of (Genetic correlation − Environmental correlation) values for the same pair of diseases. (C) Individual distributions of genetic and environmental correlations superimposed on the same plot. (D) Comparison of our family-based estimates of genetic correlations between diseases compared to previously published GWAS-based values, the complete data on values and references is provided in the Supplement Table 5. Linear fit with a slope of 1.08 (SE=0.167) is indicated by the dotted line.

Similar articles

Cited by

References

    1. van de Water T, Suliman S, Seedat S. Gender and cultural issues in psychiatric nosological classification systems. CNS Spectr. 2016;21:334–340. - PubMed
    1. Kendler KS. The nature of psychiatric disorders. World Psychiatry. 2016;15:5–12. - PMC - PubMed
    1. Endlicher S. In: Genera plantarum secundum ordines naturales disposita. Beck F, editor. 1836.
    1. Jussieu ALd, Stafleu FA. In: Genera plantarum. Cramer J, editor. Stechert-Hafner Service Agency; 1964.
    1. Linne Cv, et al. The families of plants : with their natural characters, according to the number, figure, situation, and proportion of all of the parts of fructification. 1787. Printed by John Jackson, sold by J. Johnson … T. Byrne … and J. Balfour.

MeSH terms