

Comparison of relationships between four common anthropometric measures and incident diabetes
- PMID: 28783531
- PMCID: PMC5728360
- DOI: 10.1016/j.diabres.2017.07.022
Comparison of relationships between four common anthropometric measures and incident diabetes
Abstract
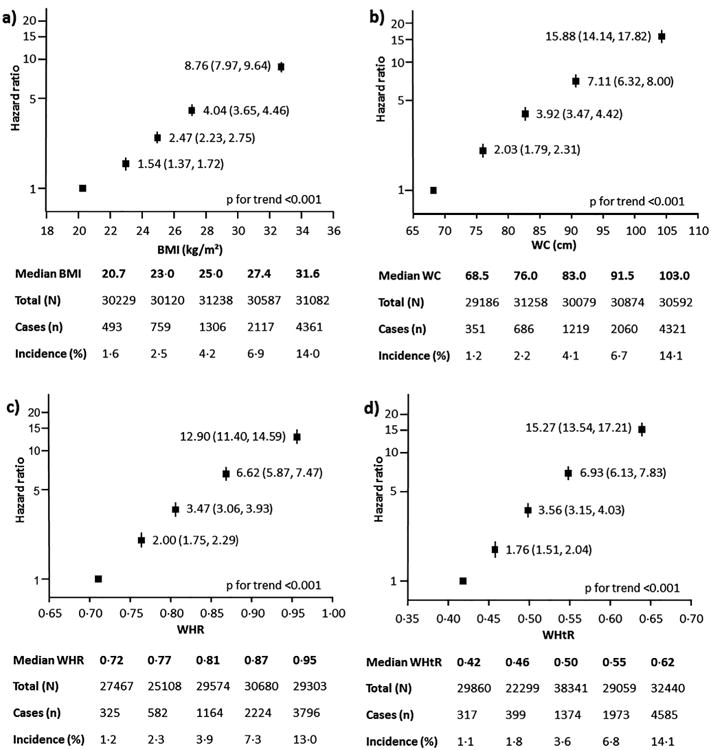
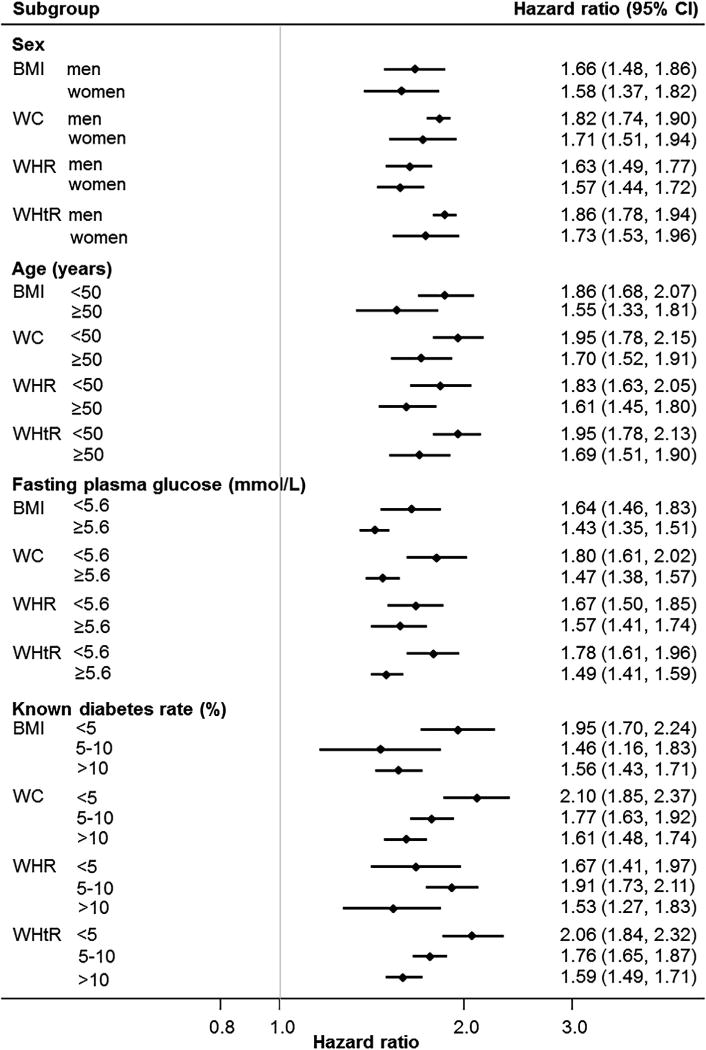
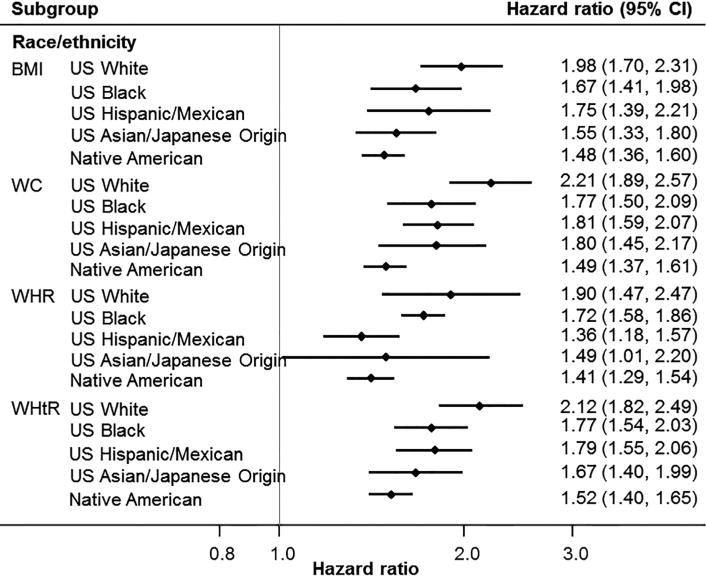
Aims: First, to conduct a detailed exploration of the prospective relations between four commonly used anthropometric measures with incident diabetes and to examine their consistency across different population subgroups. Second, to compare the ability of each of the measures to predict five-year risk of diabetes.
Methods: We conducted a meta-analysis of individual participant data on body mass index (BMI), waist circumference (WC), waist-hip and waist-height ratio (WHtR) from the Obesity, Diabetes and Cardiovascular Disease Collaboration. Cox proportional hazard models were used to estimate the association between a one standard deviation increment in each anthropometric measure and incident diabetes. Harrell's concordance statistic was used to test the predictive accuracy of each measure for diabetes risk at five years.
Results: Twenty-one studies with 154,998 participants and 9342 cases of incident diabetes were available. Each of the measures had a positive association with incident diabetes. A one standard deviation increment in each of the measures was associated with 64-80% higher diabetes risk. WC and WHtR more strongly associated with risk than BMI (ratio of hazard ratios: 0.95 [0.92,0.99] - 0.97 [0.95,0.98]) but there was no appreciable difference between the four measures in the predictive accuracy for diabetes at five years.
Conclusions: Despite suggestions that abdominal measures of obesity have stronger associations with incident diabetes and better predictive accuracy than BMI, we found no overall advantage in any one measure at discriminating the risk of developing diabetes. Any of these measures would suffice to assist in primary diabetes prevention efforts.
Keywords: Body mass index; Diabetes; Waist circumference.
Copyright © 2017 Elsevier B.V. All rights reserved.
Figures
References
-
- World Health Organization. Obesity and overweight fact sheet No. 311. [accessed 06.11.15]; http://www.who.int/mediacentre/factsheets/fs311/en/;
-
- Turner LR, Harris MF, Mazza D. Obesity management in general practice: does current practice match guideline recommendations? Med J Aust. 2015;202:370–3. - PubMed
MeSH terms
Grants and funding
- HHSN268201100012C/HL/NHLBI NIH HHS/United States
- HHSN268201100009I/HL/NHLBI NIH HHS/United States
- HHSN268201300026C/HL/NHLBI NIH HHS/United States
- HHSN268201100010C/HL/NHLBI NIH HHS/United States
- HHSN268201100008C/HL/NHLBI NIH HHS/United States
- HHSN268201100007C/HL/NHLBI NIH HHS/United States
- HHSN268201100011C/HL/NHLBI NIH HHS/United States
- UL1 TR001409/TR/NCATS NIH HHS/United States
- HHSN268201300025C/HL/NHLBI NIH HHS/United States
- M01 RR000037/RR/NCRR NIH HHS/United States
- R01 AG007181/AG/NIA NIH HHS/United States
- HHSN268201100006C/HL/NHLBI NIH HHS/United States
- R01 DK031801/DK/NIDDK NIH HHS/United States
- R01 DK031170/DK/NIDDK NIH HHS/United States
- P30 DK035816/DK/NIDDK NIH HHS/United States
- HHSN268201100007I/HL/NHLBI NIH HHS/United States
- P30 DK017047/DK/NIDDK NIH HHS/United States
- HHSN268201100005G/HL/NHLBI NIH HHS/United States
- HHSN268201100008I/HL/NHLBI NIH HHS/United States
- K24 DK002654/DK/NIDDK NIH HHS/United States
- HHSN268201100011I/HL/NHLBI NIH HHS/United States
- HHSN268200900041C/HL/NHLBI NIH HHS/United States
- HHSN268201300028C/HL/NHLBI NIH HHS/United States
- HHSN268201100005I/HL/NHLBI NIH HHS/United States
- HHSN268201100009C/HL/NHLBI NIH HHS/United States
- R01 HL049293/HL/NHLBI NIH HHS/United States
- HHSN268201100005C/HL/NHLBI NIH HHS/United States
- HHSN268201300029C/HL/NHLBI NIH HHS/United States
- R37 AG007181/AG/NIA NIH HHS/United States
LinkOut - more resources
Full Text Sources
Other Literature Sources
Medical
