. 2016 Jul 14;1(1):aaf6925.
doi: 10.1126/sciimmunol.aaf6925. Epub 2016 Jun 23.

In-depth tissue profiling using multiplexed immunohistochemical consecutive staining on single slide

Affiliations

In-depth tissue profiling using multiplexed immunohistochemical consecutive staining on single slide

Romain Remark et al. Sci Immunol. .

Abstract

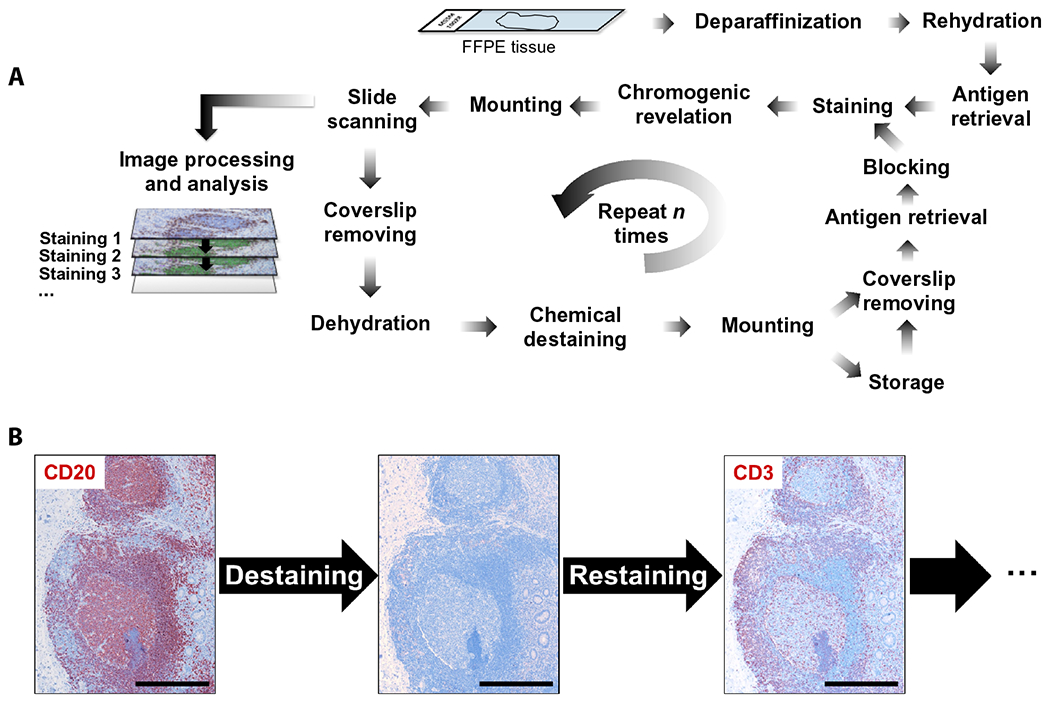
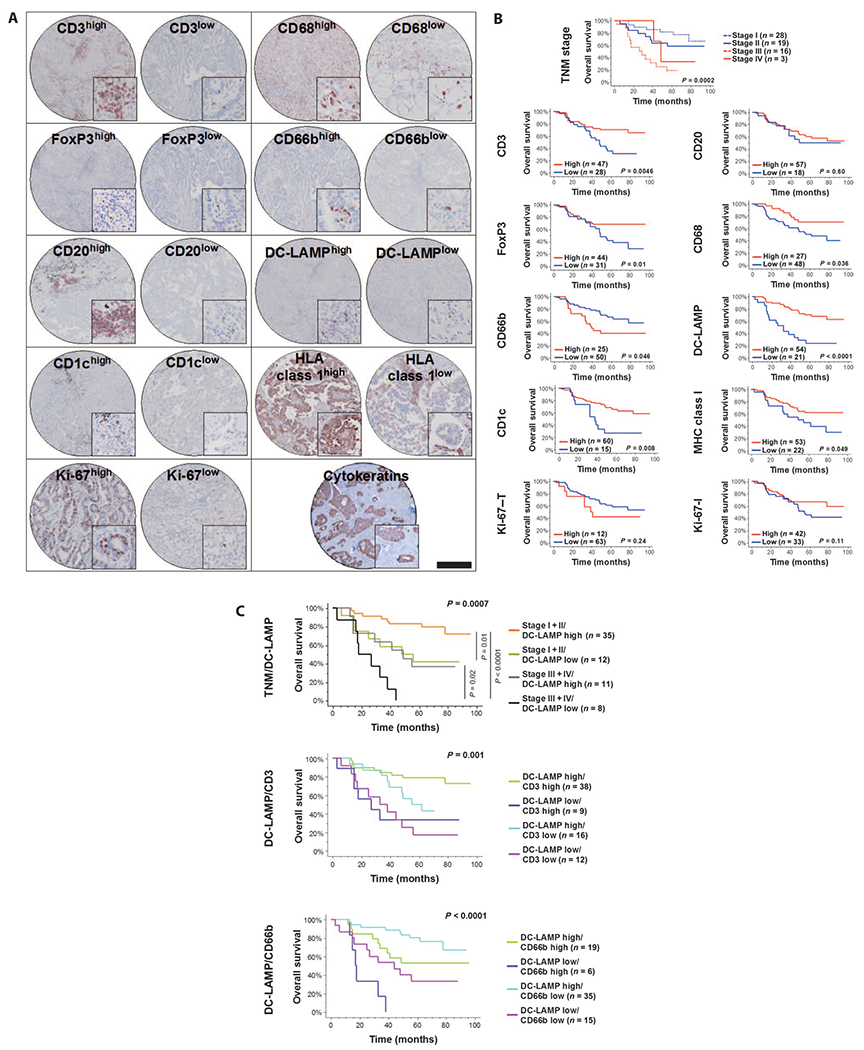
Despite remarkable recent achievements of immunotherapy strategies in cancer treatment, clinical responses remain limited to subsets of patients. Predictive markers of disease course and response to immunotherapy are urgently needed. Recent results have revealed the potential predictive value of immune cell phenotype and spatial distribution at the tumor site, prompting the need for multidimensional immunohistochemical analyses of tumor tissues. To address this need, we developed a sample-sparing, highly multiplexed immunohistochemistry technique based on iterative cycles of tagging, image scanning, and destaining of chromogenic substrate on a single slide. This assay, in combination with a newly developed automated digital landscaping solution, democratizes access to high-dimensional immunohistochemical analyses by capturing the complexity of the immunome using routine pathology standards. Applications of the method extend beyond cancer to screen and validate comprehensive panels of tissue-based prognostic and predictive markers, perform in-depth in situ monitoring of therapies, and identify targets of disease.


Conflict of interest statement

Competing interests: The authors declare that they have no competing interests.

Figures

Fig. 1.
Fig. 1.. MICSSS workflow.
(A) MICSSS protocol. FFPE tissue sections (5 μm) were incubated with primary Abs followed by biotinylated secondary Abs, streptavidin-HRP, and AEC. Stained tissue sections were counterstained, mounted, and scanned. After each scanning procedure, the slide coverslip was removed, and AEC chromogen was dissolved. Tissue sections underwent antigen retrieval and were then incubated in a blocking buffer before the initiation of a new staining cycle. (B) A 5-μm FFPE gut section obtained from an ulcerative colitis patient was stained with anti-CD20 Ab and destained and stained with anti-CD3 Ab following the MICSSS workflow. The exact same tissue can be stained several times using the MICSSS method. Scale bars, 0.5 mm.
Fig. 2.
Fig. 2.. MICSSS helps characterize the tumor immune microenvironment.
Colorectal cancer tissue section was sequentially stained and scanned for hematoxylin, CD3, CD8, CD2, FoxP3, CD20, DC-LAMP, and Ki-67. Bright-field images were inverted, and RGB channel splitting was performed. Upper panels show single staining for each individual staining. Some selected images were merged, and pseudocolors were attributed to each marker (lower panels). Immune cells were mostly localized in the stroma surrounding the tumor islets. Right insets show magnifications of single-positive, double-positive (for example, CD3+ CD8+ or CD3+ FoxP3+), or triple-positive (for example, CD3+ FoxP3+ Ki-67+) cells, allowing an accurate determination of cell phenotype and state. Scale bars, 50 μm.
Fig. 3.
Fig. 3.. MICSSS does not alter tissue antigenicity.
(A) A series of 12 adjacent 5-μm FFPE sections were obtained from a colorectal tumor tissue, and each slide was stained with a panel of Abs using the MICSSS workflow but in a different Ab sequence order for each slide. Line graph shows the densities of tumor-associated immune cells positive for CD1a, CD1c, CD2, CD3, CD8, CD20, CD66b, CD68, CD138, FoxP3, DC-LAMP, and Ki-67 whether each marker was stained before or after one to seven destaining cycles. (B) Representative pictures revealed similar staining intensity whether the marker was stained before or after several staining/destaining cycles. Scale bars, 200 μm.
Fig. 4.
Fig. 4.. MICSSS can selectively remove one chromogen-stained marker while preserving a fixed diagnostic marker.
Lung adenocarcinoma tissue section was permanently stained with anti-cytokeratin Abs (clones AE1 and AE3) revealed by DAB (brown) and sequentially stained and destained with anti-CD20, anti–Ki–67, anti–DC-LAMP, and anti-CD138 Abs and revealed by AEC in red. The cytokeratin staining was kept as a reference along the staining process because the destaining process, which selectively removed only the AEC stain, did not affect it. Scale bars, 2 mm, 100 μm, and 50 μm for the upper, middle, and lower panels, respectively.
Fig. 5.
Fig. 5.. MICSSS helps monitor tumor response to immunotherapy regimen.
(A) FFPE melanoma tissue sections (5 μm) isolated before and after treatment with ipilimumab from one responder and one nonresponder patient were stained following the MICSSS method. Each tissue section was stained sequentially with hematoxylin and anti–PD-L1, anti-CD68, anti–DC-LAMP, anti-CD20, anti-CD3, and anti-FoxP3 Abs, and images were overlaid. (B and C) Images show the expression of PD-L1 by either CD68+ macrophages (B) or DC-LAMP+ mature DCs (C) in a responder patient. Scale bars, 100 μm.
Fig. 6.
Fig. 6.. MICSSS helps identify immune prognostic markers in cancer patients.
(A) Representative images of different biopsy sections obtained from NSCLC TMA sequentially stained with anti-CD3, anti-CD20, anti-FoxP3, anti-CD68, anti-CD66b, anti–DC-LAMP, anti-CD1c, anti–MHC class I, anti–Ki-67, and anti-cytokeratin Abs. Scale bar, 0.5 mm. (B) Kaplan-Meier curves illustrate the duration of overall survival according to the TNM stage and the densities of CD3+, CD20+, FoxP3+, CD68+ CD66b+, DC-LAMP+, CD1c+, Ki-67+, and MHC class I+ cells. Red lines represent high cell densities (or high expression) and blue lines represent low densities (or low expression). (C) Kaplan-Meier curves illustrate the duration of overall survival according to the combined analysis of TNM stage and immune cell densities (CD3+, DC-LAMP+, and CD66b+).

References

    1. De Obaldia ME, Bhandoola A, Transcriptional regulation of innate and adaptive lymphocyte lineages. Anna. Rev. Immunol 33, 607–642 (2015). - PubMed
    1. Spits H, Cupedo T, Innate lymphoid cells: Emerging insights in development, lineage relationships, and function. Anna. Rev. Immunol 30, 647–675 (2012). - PubMed
    1. van de Pavert SA, Mebius RE, New insights into the development of lymphoid tissues. Nat. Rev. Immunol 10, 664–674 (2010). - PubMed
    1. Fridman WH, Pagès F, Sautès-Fridman C, Galon J, The immune contexture in human tumours: Impact on clinical outcome. Nat. Rev. Cancer 12, 298–306 (2012). - PubMed
    1. Shalapour S, Karin M, Immunity, inflammation, and cancer: An eternal fight between good and evil. J. Clin. Invest 125, 3347–3355 (2015). - PMC - PubMed

LinkOut - more resources