. 2017 Aug 10;548(7666):234-238.
doi: 10.1038/nature23291. Epub 2017 Aug 2.

Tumours with class 3 BRAF mutants are sensitive to the inhibition of activated RAS

Affiliations

Tumours with class 3 BRAF mutants are sensitive to the inhibition of activated RAS

Zhan Yao et al. Nature. .

Abstract

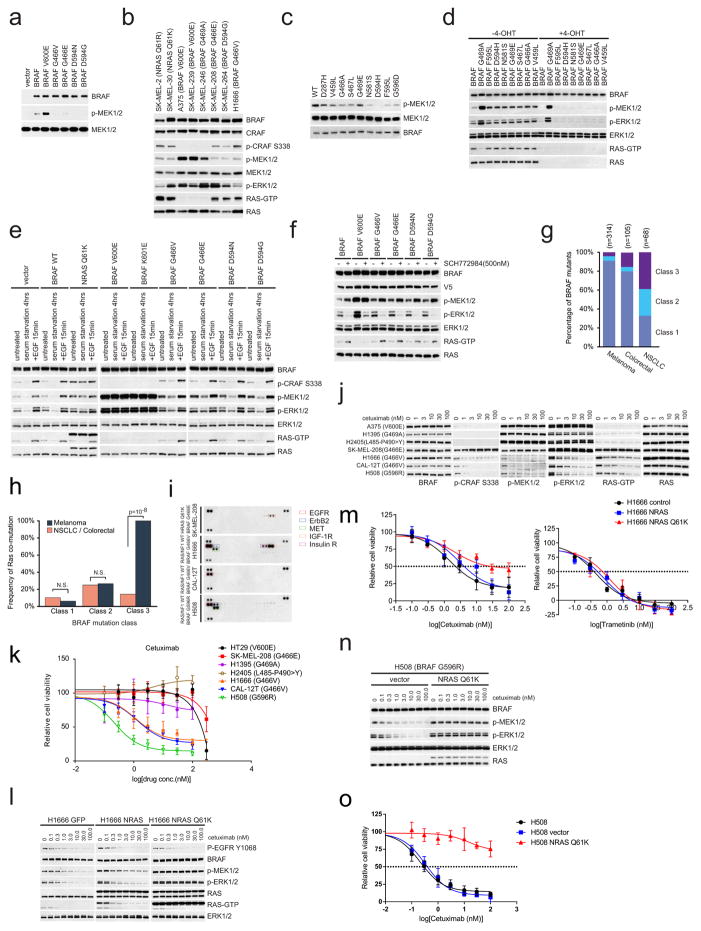
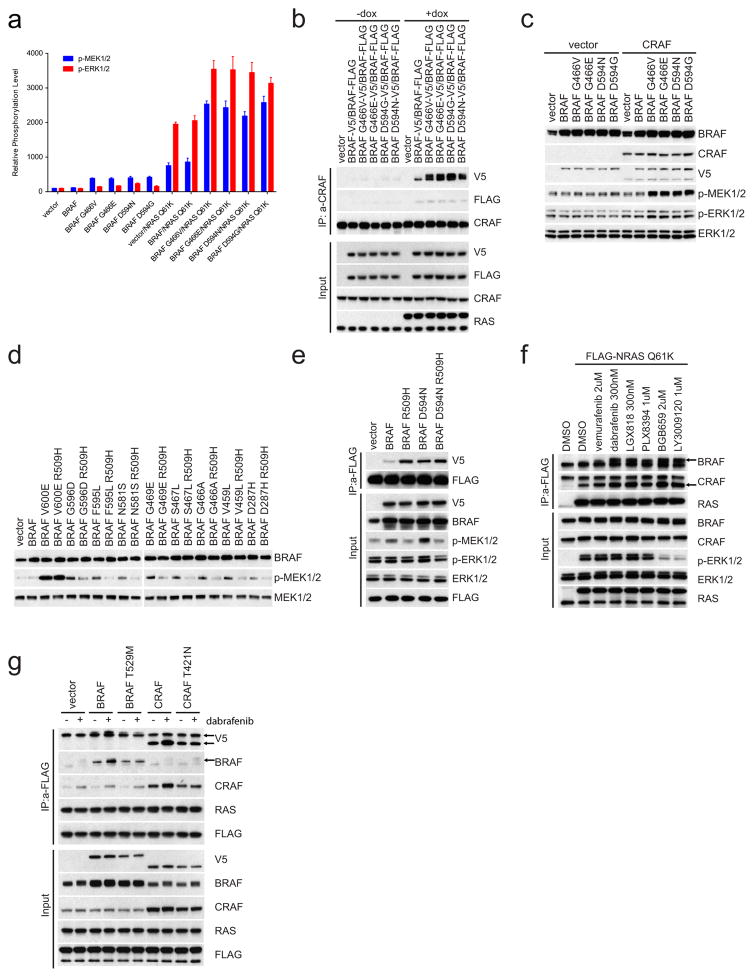
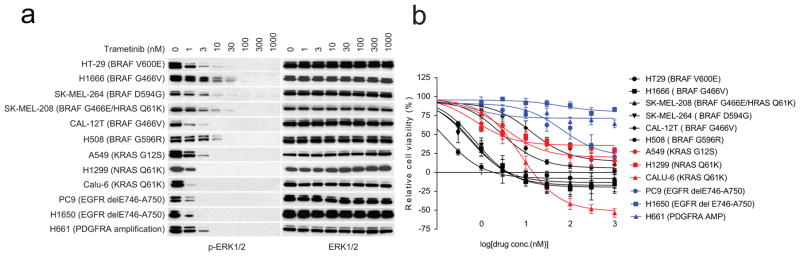
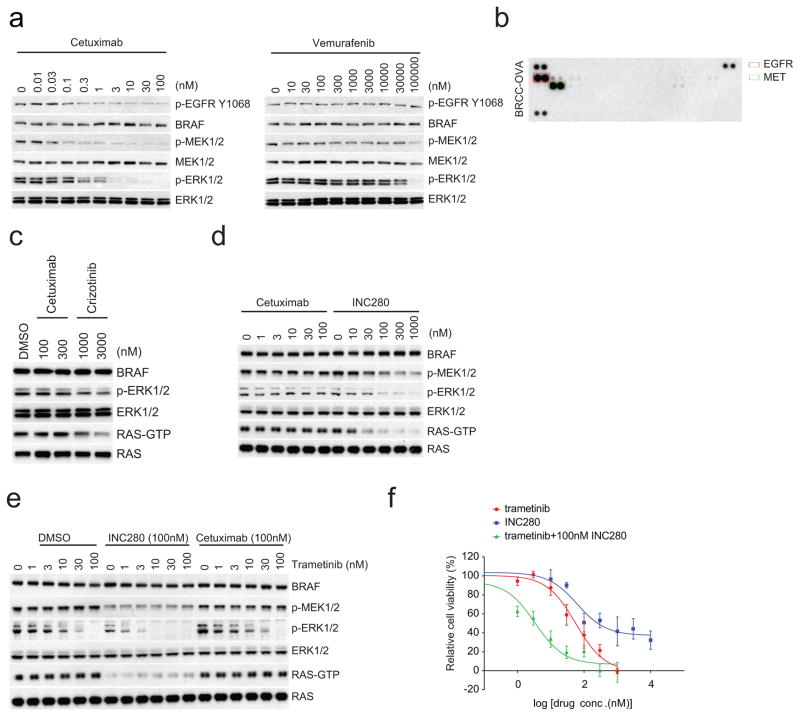
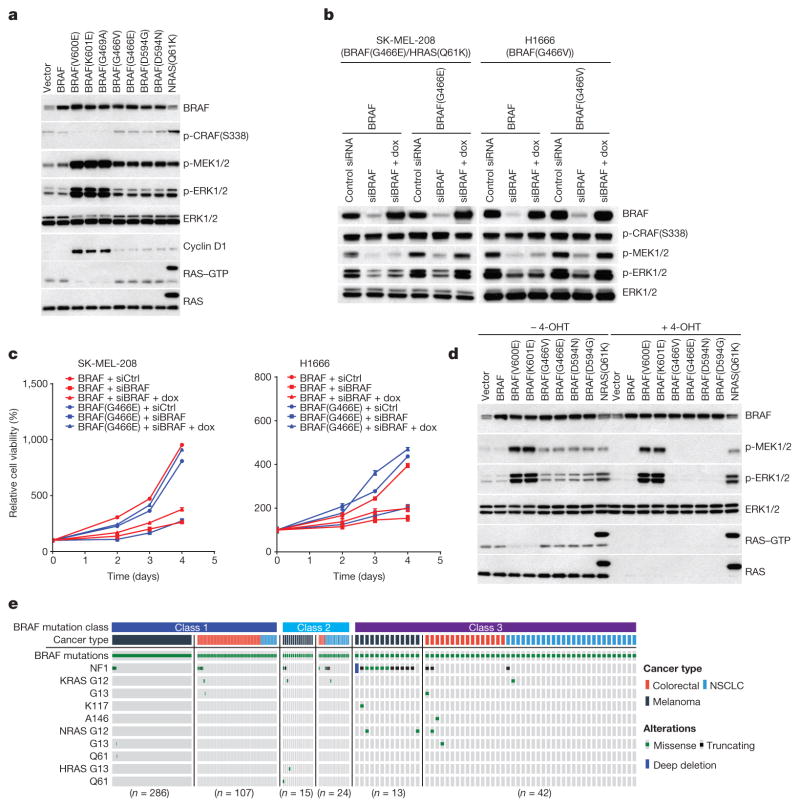
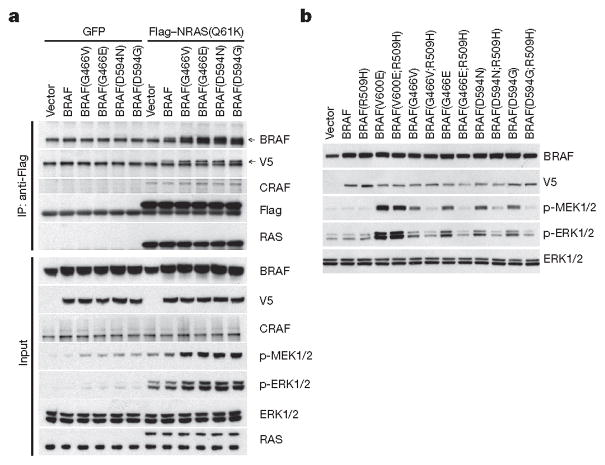
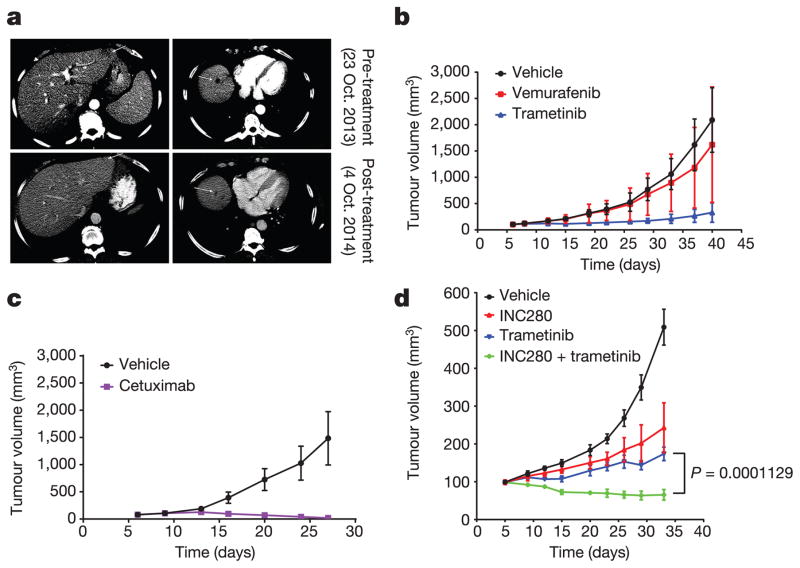
Approximately 200 BRAF mutant alleles have been identified in human tumours. Activating BRAF mutants cause feedback inhibition of GTP-bound RAS, are RAS-independent and signal either as active monomers (class 1) or constitutively active dimers (class 2). Here we characterize a third class of BRAF mutants-those that have impaired kinase activity or are kinase-dead. These mutants are sensitive to ERK-mediated feedback and their activation of signalling is RAS-dependent. The mutants bind more tightly than wild-type BRAF to RAS-GTP, and their binding to and activation of wild-type CRAF is enhanced, leading to increased ERK signalling. The model suggests that dysregulation of signalling by these mutants in tumours requires coexistent mechanisms for maintaining RAS activation despite ERK-dependent feedback. Consistent with this hypothesis, melanomas with these class 3 BRAF mutations also harbour RAS mutations or NF1 deletions. By contrast, in lung and colorectal cancers with class 3 BRAF mutants, RAS is typically activated by receptor tyrosine kinase signalling. These tumours are sensitive to the inhibition of RAS activation by inhibitors of receptor tyrosine kinases. We have thus defined three distinct functional classes of BRAF mutants in human tumours. The mutants activate ERK signalling by different mechanisms that dictate their sensitivity to therapeutic inhibitors of the pathway.


Conflict of interest statement

The authors declare competing financial interests: details are available in the online version of the paper.

Figures

Extended Data Figure 1
Extended Data Figure 1. Activation of MEK/ERK signalling by hypoactive BRAF mutants is RAS-dependent
a, V5-tagged wild-type (WT) or mutant BRAF kinases were expressed in 293H cells that stably express NRAS(Q61K). These BRAF protein kinases were isolated with anti-V5 agarose. The in vitro kinase assay was performed with kinase-dead MEK1(K97R). The phosphorylation of MEK1 was determined by western blot. For gel source data, see Supplementary Fig. 4. b, Western blot analysis for components of the RAS/RAF/ERK signalling pathway in a panel of cancer cell lines harbouring the indicated mutations. Cellular RAS–GTP levels were determined by the active RAS pull-down assay. For gel source data, see Supplementary Fig. 4. c, In vitro kinase activity of the indicated BRAF proteins which were isolated from 293H cells that stably express NRAS(Q61K) was assessed as described in a. For gel source data, see Supplementary Fig. 4. d, MEK/ERK activation mediated by indicated BRAF proteins was assayed as described in Fig. 1d. For gel source data, see Supplementary Fig. 4. e, NIH3T3 cells expressing the indicated BRAF proteins were stimulated with 100 ng ml−1 EGF for 15 min, serum deprived for 6 h, or left untreated. RAS/RAF/MEK/ERK signalling activation of these cells was examined by western blot. Cellular RAS–GTP levels were determined by the active RAS pull-down assay. For gel source data, see Supplementary Fig. 5. f, Cells as indicated in Fig. 1a were cultured in doxycycline (30 ng ml−1) containing medium for 24 h and then treated with 500 nM ERK inhibitor SCH772984 for 8 h. Whole-cell lysates were then prepared and examined by western blot. RAS–GTP levels were determined using the active RAS pull-down assay. For gel source data, see Supplementary Fig. 5. g, The frequency distribution of the three classes of BRAF mutants in human BRAF-mutant melanoma tumours, or colorectal or non-small cell lung carcinomas. The data were collected from http://cbioportal.org. h, The frequency of coexistent RAS or NF1 alterations in human BRAF mutant melanomas compared to that in NSCLC and colorectal cancers.. The calculation was based on the sample sets as shown in Fig. 1e. The P values were calculated by using a paired t-test. N.S., not significant. i, The phosphorylation of multiple RTKs in the indicated cell lines was assayed using the Human Phospho-RTK Array Kit. Phosphorylated RTKs are highlighted with boxes in different colours. j, Cells were treated with increasing concentrations of cetuximab for 4 h. Levels of ERK signalling intermediates were determined by western blot. Cellular RAS–GTP levels were determined by the active RAS pull-down assay. For gel source data, see Supplementary Fig. 6. k, Cells were cultured and exposed to cetuximab at concentrations of 0, 0.3, 1, 3, 10, 30, 100 and 300 nM for 3 days. The effects of drug on cell growth were quantified using the ATP-Glo assay. Graphs were generated using Prism 6 (mean ±s.d. are represented by the dots and error bars, n =8). l, GFP, wild-type NRAS or NRAS(Q61K) were stably expressed in H1666 cells. Then the indicated cells were treated with cetuximab at increasing doses for 2 h. Cells were collected and cell lysates were examined by western blot. RAS–GTP levels were determined using the active RAS pull-down assay. For gel source data, see Supplementary Fig. 7. m, The effects of cetuximab or trametinib on the growth of the cells described in l was determined by ATP-Glo assay after 3 days treatment. Graphs were generated using Prism 6 (mean ± s.d., n = 8). n, NRAS(Q61K) or vector was stably expressed in H508 cells. The cells were treated with cetuximab at increasing doses for 2 h. Cells were collected and cell lysates were examined by western blot. For gel source data, see Supplementary Fig. 7. o, Growth inhibition of the cells described in n after three days exposure to varying doses of cetuximab on day 3 was determined by ATP-Glo assay. Graphs were generated using Prism 6 (mean ± s.d., n =8)
Extended Data Figure 2
Extended Data Figure 2. Enhanced binding of hypoactive BRAF mutants to RAS increases activated mutant BRAF–wild-type CRAF heterodimers and amplifies ERK signalling
a, The levels of p-MEK1/2 and p-ERK1/2 in each transfectant in Fig. 2a were quantified by densitometry analysis using ImageJ software. The columns represent the relative levels of p-MEK/12 and p-ERK1/2 as normalized to the levels in cells transfected with vector plasmid and the expression levels of V5-tagged BRAF proteins (mean ± s.d. calculated on the basis of four independent experiments). b, Flag-tagged wild-type BRAF was co-expressed with the indicated V5-tagged BRAF proteins in 293H cells that were induced to express NRAS(Q61K). CRAF-bound BRAF proteins were determined by immunoprecipitation followed by western blot analysis. The results show RAS-dependent enhanced binding of CRAF to hypoactive BRAF mutants compared to their binding to wild-type BRAF. For gel source data, see Supplementary Fig. 8. c, V5-tagged wild-type or mutant BRAF kinases were expressed in Raf1-knockout cells with or without V5-tagged CRAF expression. For gel source data, see Supplementary Fig. 8. d, 293H cells were transfected with plasmids that encode the indicated BRAF proteins. After 24 h, the cells were collected. Cell lysates were then analysed by western blot with the indicated antibodies. For gel source data, see Supplementary Fig. 8. e, 293H cells stably expressing Flag-tagged NRAS(Q61K) were transfected with pcDNA3 plasmids expressing indicated proteins. The interaction between active RAS and the indicated BRAF proteins was determined by immunoprecipitation with anti-Flag beads. For gel source data, see Supplementary Fig. 9. f, 293H cells stably expressing Flag-tagged NRAS(Q61K) were treated with indicated RAF inhibitors for 1 h. The mutant RAS-bound BRAF and CRAF proteins were pulled down by immunoprecipitation with anti-Flag antibody and examined by western blot with indicated antibodies. For gel source data, see Supplementary Fig. 9. g, V5 tagging identified BRAF or CRAF proteins that were expressed in 293H cells stably expressing Flag-tagged NRAS(Q61K). BRAF(T529M) and CRAF(T421N) gatekeeper mutants that do not bind inhibitors were used as controls. NRAS-bound mutant BRAF and CRAF proteins were pulled down by anti-FLAG antibody from cells treated with or without dabrafenib (1 μM, 1 h). The immunoprecipitated proteins were assayed by western blot. For gel source data, see Supplementary Fig. 9.
Extended Data Figure 3
Extended Data Figure 3. ERK signalling in hypoactive BRAF-mutant cells is sensitive to trametinib
a, Inhibition of ERK signalling in a panel of cell lines exposed trametinib for 1 h at indicated doses. For gel source data, see Supplementary Fig. 10. b, The cell lines as indicated in a were treated with different concentrations of trametinib for 3 days. Cell viability was determined by ATP-Glo assay. Dose-dependent inhibition curves were generated using Prism 6 (mean ± s.d., n =8).
Extended Data Figure 4
Extended Data Figure 4. In hypoactive BRAF-mutant tumours with wild-type RAS/NF1 ERK signalling is sensitive to upstream inhibition of RAS
a, Cells isolated from the patient-derived xenograft (PDX) models as described (Fig. 4b) were treated with increasing doses of vemurafenib for 1 h or cetuximab for 4 h. Levels of indicated proteins were examined by western blot. For gel source data, see Supplementary Fig. 10. b, RTK phosphorylation profile of the cells isolated from the ovarian metastatisis derived PDX (BRCC-OVA) was assessed with Human Phospho-RTK arrays. The elevated p-EGFR and p-MET bands are within the red and green rectangles, respectively. c, Cells isolated from BRCC-OVA were treated with indicated drugs for 4 h and cell lysates were then analysed. For gel source data, see Supplementary Fig. 11. d, e, The BRCC-OVA cells were treated with indicated drugs or combinations thereof over a range of drug concentrations for 4 h. INC280 is a selective inhibitor of MET activity. The ERK signalling was assayed by western blot. The cellular RAS–GTP level was determined using the active RAS pull-down assay. For gel source data, see Supplementary Fig. 11. f, The growth inhibition of BRCC-OVA cells with indicated drugs at 0, 1, 3, 10, 30, 100, 300 and 1,000 nM of trametinib or 0, 10, 30, 100, 300, 1,000, 3,000 and 10,000 nM of INC280 or combination of increasing dose of trametinib with 100 nM INC280 was determined by ATP-Glo assay after 3 days of treatment. Graphs were generated using Prism 6 (mean ±s.d., n = 8).
Figure 1
Figure 1. Activation of MEK/ERK by low-activity or kinase-dead BRAF mutants is RAS-dependent
a, ERK signalling was assessed in NIH3T3 cells expressing the indicated BRAF proteins (30 ng ml−1 doxycycline, 24 h). b, c, Inducible wild-type BRAF or mutant BRAF (G466E or G466V) was introduced into H1666 or SK-MEL-208 cells. The indicated cells were transfected with control siRNA or siRNA against the human BRAF gene. b, After 1 day, 106 cells of each cell line were treated with doxycycline (dox; 30 ng ml−1, for 24 h) and ERK was assessed. c, 3,000 cells of each siRNA transfected cell line were then plated in 96-well plates in medium with doxycycline. Cell growth was determined by ATP-Glo assay. Growth curves were generated with Prism 6 (mean ± s.d., n = 8). d, Expression of indicated BRAF proteins was induced (10 ng ml−1 doxycycline, 24 h) in the conditional RAS-less cells that were pre-treated with 4-hydroxytamoxifen (4-OHT) to knock out the last RAS allele. In a, b and d, Erk signalling was examined by western blot and RAS–GTP levels were determined by the active RAS pull-down assay. The gel source data are provided in Supplementary Fig. 1. e, Oncoprint showing co-mutation of class 3 BRAF mutants with RAS/NF1 in samples from cancer patients. The data were collected from http://cbioportal.org.
Figure 2
Figure 2. Class 3 BRAF mutants bind more avidly than wild type to active RAS and signal as dimers
a, 293H cells stably expressing GFP or Flag-tagged NRAS(Q61K) were transfected with empty pcDNA3 vector or pcDNA3 encoding the indicated V5-tagged BRAF proteins. 24 h after transfection, cells were collected and NRAS(Q61K) was immunoprecipitated with anti-Flag antibody. b, 293H cells were transfected with pcDNA3 plasmids encoding the indicated BRAF proteins or the same proteins into which the R509H mutation was inserted. After 24 h, the cells were treated with serum-free medium for 4 h and then collected. For gel source data, see Supplementary Fig. 2.
Figure 3
Figure 3. In tumour cells with class 3 BRAF mutants, ERK signalling is sensitive to trametinib but not vemurafenib
a, IC50 values for growth inhibition by trametinib of the indicated cell lines (mean ± s.d., n =8). IC50 is calculated as shown in Extended Data Fig. 3b. b, NIH3T3 cells expressing the indicated BRAF proteins were exposed to 20 ng ml−1 doxycycline for 24 h. Cells were then treated with vemurafenib (1 h) at various concentrations in the presence of doxycyclin. Cells were collected and cell lysates were examined. The relative p-MEK levels on each blot as shown in the curves were determined by densitometry analysis using ImageJ. The dose–response curves were generated by GraphPad Prism 6. c, Cells were treated with vemurafenib at the indicated concentrations for 1 h. For gel source data, see Supplementary Fig. 3.
Figure 4
Figure 4. Class 3 BRAF-mutant tumours with wild-type RAS/NF1 are sensitive to inhibition of RTK-dependent RAS activation
a, A patient with metastatic colorectal cancer (BRAF(G466V)) involving the liver was treated with panitumumab plus irinotecan. Their liver lesions (marked with arrows on CT scan) were compared before or after 4 months of drug treatment. b, c, PDX was established from a tumour biopsy specimen from the patient indicated in a. Drug response was monitored by measurement of the tumour sizes. Vemurafenib was given at 75 mg kg−1 twice per day, trametinib 1.5 mg kg−1 once daily. Cetuximab (50 mg kg−1) was given twice per week. Data in graphs are mean ± s.d., n =10. d, PDX was established from the progressing ovarian metastasis from a CDC patient. INC280 was given at 10 mg kg−1 twice per day, trametinib 1.5 mg kg−1 once daily. Data in graphs are mean ±s.d., n = 5. P value calculated by unpaired t-test.

Comment in

References

    1. Yao Z, et al. BRAF mutants evade ERK-dependent feedback by different mechanisms that determine their sensitivity to pharmacologic inhibition. Cancer Cell. 2015;28:370–383. - PMC - PubMed
    1. Wan PT, et al. Mechanism of activation of the RAF-ERK signaling pathway by oncogenic mutations of B-RAF. Cell. 2004;116:855–867. - PubMed
    1. Drosten M, et al. Genetic analysis of Ras signalling pathways in cell proliferation, migration and survival. EMBO J. 2010;29:1091–1104. - PMC - PubMed
    1. Heidorn SJ, et al. Kinase-dead BRAF and oncogenic RAS cooperate to drive tumor progression through CRAF. Cell. 2010;140:209–221. - PMC - PubMed
    1. Cancer Genome Atlas Network. Genomic classification of cutaneous melanoma. Cell. 2015;161:1681–1696. - PMC - PubMed

Publication types

MeSH terms