. 2017 Aug 4;12(8):e0182591.
doi: 10.1371/journal.pone.0182591. eCollection 2017.

SnRK1 activates autophagy via the TOR signaling pathway in Arabidopsis thaliana

Affiliations

SnRK1 activates autophagy via the TOR signaling pathway in Arabidopsis thaliana

Junmarie Soto-Burgos et al. PLoS One. .

Abstract

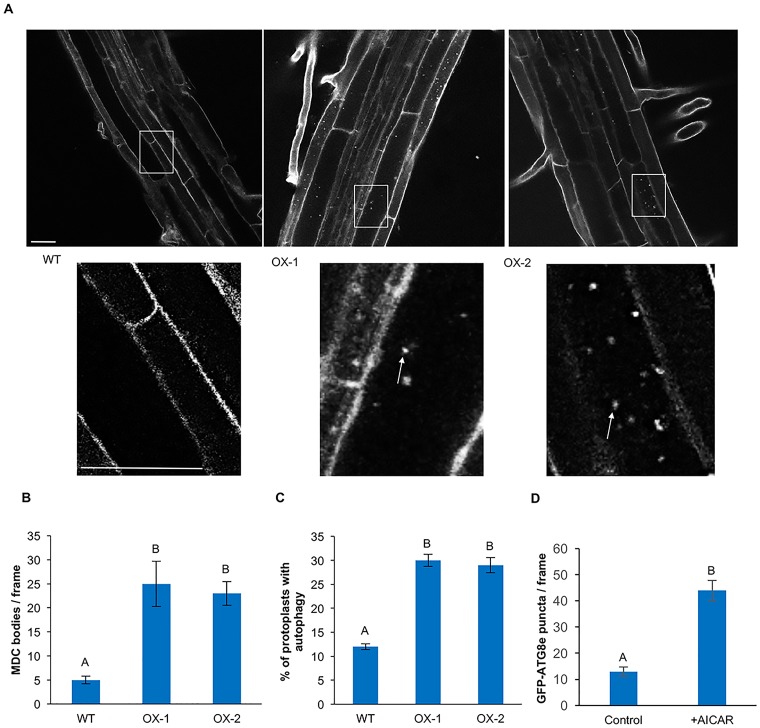
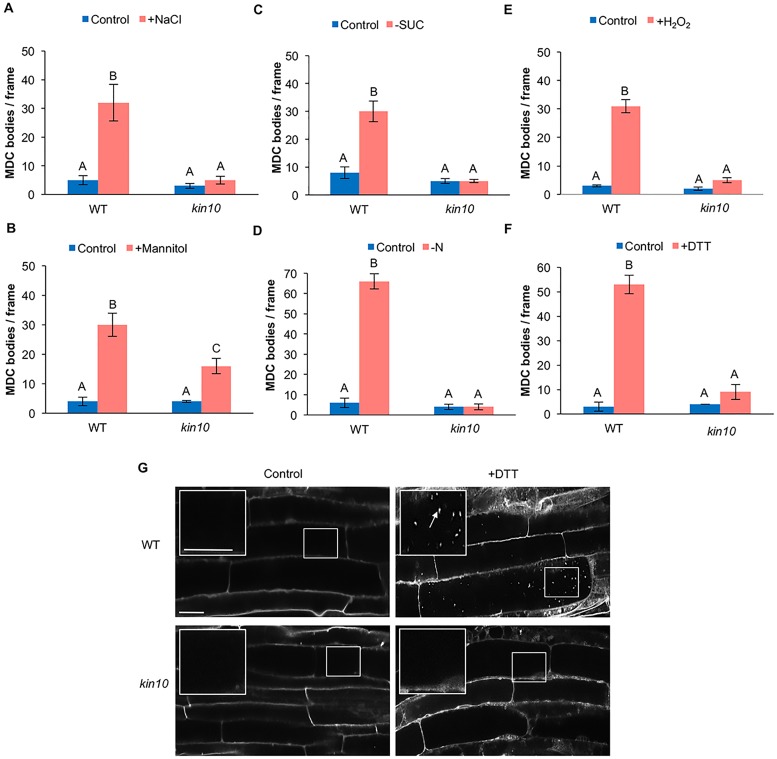
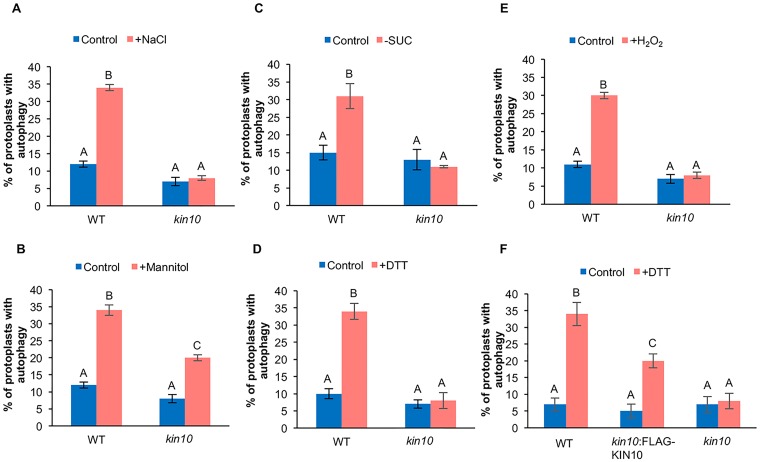
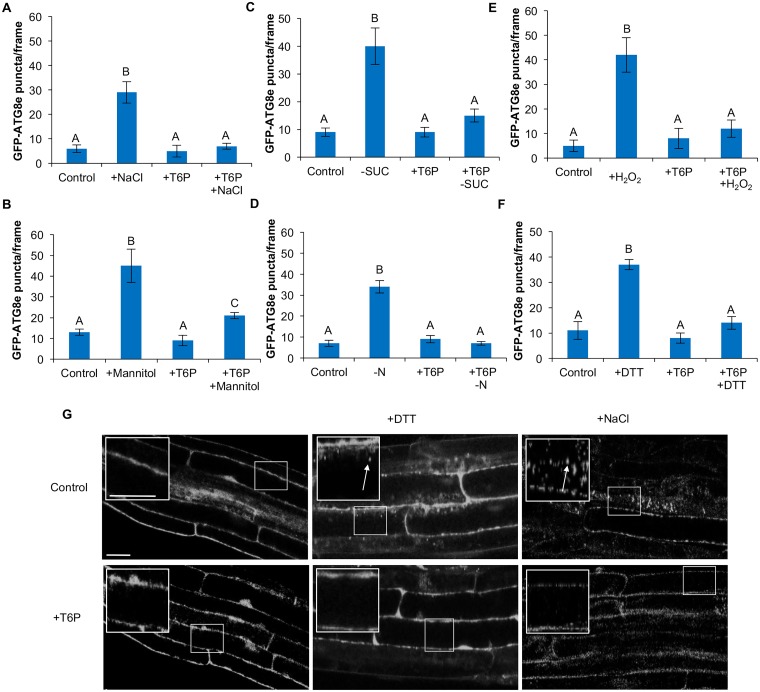
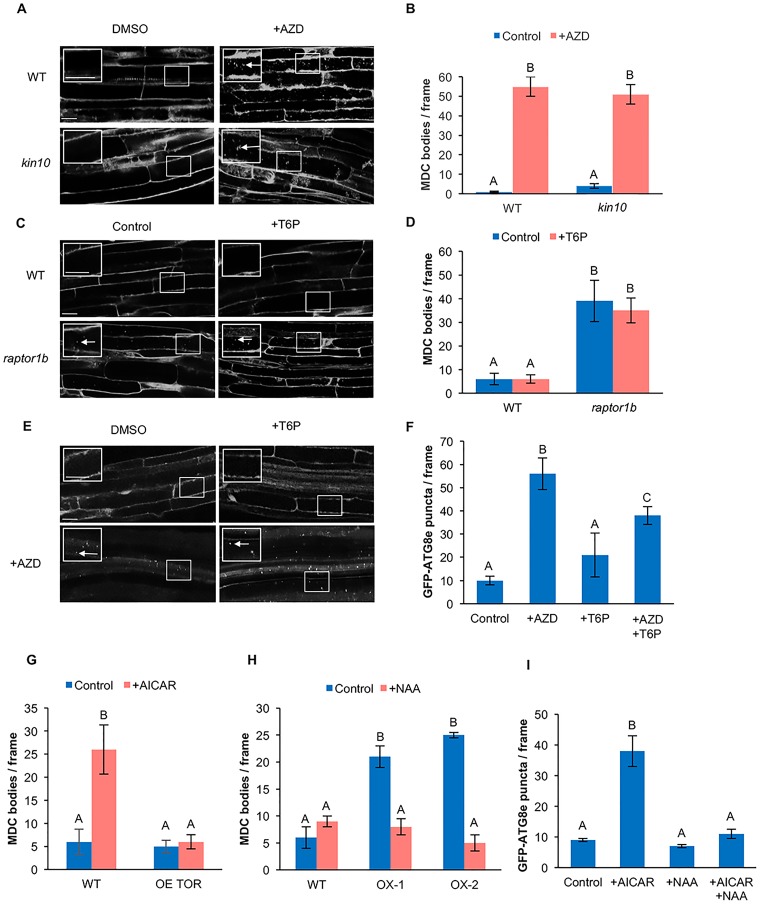
Autophagy is a degradation process in which cells break down and recycle their cytoplasmic contents when subjected to environmental stress or during cellular remodeling. The Arabidopsis thaliana SnRK1 complex is a protein kinase that senses changes in energy levels and triggers downstream responses to enable survival. Its mammalian ortholog, AMPK, and yeast ortholog, Snf-1, activate autophagy in response to low energy conditions. We therefore hypothesized that SnRK1 may play a role in the regulation of autophagy in response to nutrient or energy deficiency in Arabidopsis. To test this hypothesis, we determined the effect of overexpression or knockout of the SnRK1 catalytic subunit KIN10 on autophagy activation by abiotic stresses, including nutrient deficiency, salt, osmotic, oxidative, and ER stress. While wild-type plants had low basal autophagy activity in control conditions, KIN10 overexpression lines had increased autophagy under these conditions, indicating activation of autophagy by SnRK1. A kin10 mutant had a basal level of autophagy under control conditions similar to wild-type plants, but activation of autophagy by most abiotic stresses was blocked, indicating that SnRK1 is required for autophagy induction by a wide variety of stress conditions. In mammals, TOR is a negative regulator of autophagy, and AMPK acts to activate autophagy both upstream of TOR, by inhibiting its activity, and in a parallel pathway. Inhibition of Arabidopsis TOR leads to activation of autophagy; inhibition of SnRK1 did not block this activation. Furthermore, an increase in SnRK1 activity was unable to induce autophagy when TOR was also activated. These results demonstrate that SnRK1 acts upstream of TOR in the activation of autophagy in Arabidopsis.


Conflict of interest statement

Competing Interests: The authors have declared that no competing interests exist.

Figures

Fig 1
Fig 1. Overexpression of KIN10 leads to increased basal autophagy.
(A) WT, OX-1 and OX-2 seedlings were grown on standard growth medium for 7 days, then stained with MDC. Confocal microscopy was used to visualize autophagosomes in roots. The insets show enlargements of the indicated boxes. Arrows indicate MDC-labeled structures. Scale bars = 20 μm. (B) Quantification of the number of autophagosomes in seedlings grown as in (A). KIN10 overexpression lines have increased autophagy activity when compared to WT. Different letters denote statistical significance for three biological replicates with at least 10 images per replicate, p<0.05, t-test. Error bars indicate standard error. (C) The autophagosome marker GFP-ATG8e was transiently expressed in leaf protoplasts from the indicated genotypes and the percentage of protoplasts with active autophagy determined. A protoplast was considered to have active autophagy if it contained 3 or more GFP-ATG8e-labeled autophagosomes. KIN10 overexpression lines have increased autophagy activity when compared to WT. Different letters denote statistical significance for three biological replicates, with 100 protoplasts per sample per replicate, p<0.05, t-test. Error bars indicate standard error. (D) Seven-day-old GFP-ATG8e-expressing seedlings were transferred to liquid medium plus or minus 10 mM AICAR for 1 hour, and the number of autophagosomes per unit area counted. Seedlings treated with AICAR had higher autophagy activity than the control. Different letters denote statistical significance for three biological replicates with at least 10 images per replicate, p<0.05, t-test. Error bars indicate standard error.
Fig 2
Fig 2. Autophagy is blocked during abiotic stress in kin10 mutant seedlings.
Seven-day-old WT and kin10 seedlings were transferred to ½ MS liquid medium supplemented with 160 mM NaCl for 6 hours (A), ½ MS liquid medium supplemented with 350 mM mannitol for 6 hours (B), ½ MS plates lacking sucrose for 4 days in the dark (C), ½ MS plates lacking nitrogen for 4 days (D), ½ MS liquid medium supplemented with 10 mM hydrogen peroxide for 2 hours (E), or ½ MS liquid medium supplemented with 2 mM DTT (ER stress) for 6 hours (F). Seedlings were stained with MDC and autophagosomes counted. Autophagy was activated in WT seedlings after abiotic stress, while in kin10 mutant seedlings autophagy was not induced in most conditions. The exception was osmotic stress, in which activation of autophagy in the kin10 mutant was reduced but not completely blocked. Different letters denote statistical significance, p<0.05, t-test. Error bars indicate standard error. (G) Confocal images of WT and kin10 mutant roots under control conditions and ER stress as a representative stress. The insets show enlargements of the indicated boxes. White arrows point to autophagosomes. Scale bars = 20 μm.
Fig 3
Fig 3. Autophagy is blocked during abiotic stress in kin10 mutant protoplasts.
WT and kin10 protoplasts were transiently transformed with the autophagy marker GFP-ATG8e, incubated overnight to allow expression, and then the protoplast solution was supplemented with 160 mM NaCl for 6 hours (A), supplemented with 350 mM mannitol for 6 hours (B), incubated plus or minus 1% sucrose for 48 hours (C), supplemented with 2 mM DTT for 6 hours (D), or supplemented with 10 mM hydrogen peroxide for 2 hours (E). Autophagosomes were visualized by epifluorescence microscopy and the percentage of protoplasts with active autophagy determined. Different letters denote statistical significance for three biological replicates with 100 protoplasts for each sample per replicate, p<0.05, t-test. Error bars indicate standard error. Autophagy was activated in WT protoplasts after abiotic stress, but not in kin10 mutant protoplasts. Upon osmotic stress, activation of autophagy in the kin10 mutant was reduced but not completely blocked. (F) Protoplasts were co-transformed with FLAG-KIN10 and GFP-ATG8e constructs to confirm that the lack of autophagy in kin10 was due to disruption of the KIN10 gene. DTT was used to induce autophagy as in (D). Expression of FLAG-KIN10 restored the induction of autophagy during ER stress in the kin10 mutant. Different letters denote statistical significance for three biological replicates with 100 protoplasts for each sample per replicate, p<0.05, t-test. Error bars indicate standard error.
Fig 4
Fig 4. Inhibition of SnRK1 activity by T6P inhibits autophagy under abiotic stress.
Seven-day-old GFP-ATG8e seedlings were transferred to ½ MS liquid medium supplemented with 0.1 mM T6P for 3 hours as control, or liquid medium supplemented with 160 mM NaCl for 6 hours and 0.1 mM T6P for the last 3 hours of treatment (A), liquid medium supplemented with 350 mM mannitol for 6 hours and 0.1 mM T6P for the last 3 hours of treatment (B), ½ MS plates lacking sucrose for 4 days in the dark followed by 0.1 mM T6P treatment in liquid medium for 3 hours (C), ½ MS plates lacking nitrogen for 4 days followed by 0.1 mM T6P treatment in liquid medium for 3 hours (D), liquid medium supplemented with 0.1 mM T6P for 3 hours and 10 mM hydrogen peroxide added for the last 2 hours (E), or liquid medium supplemented with 2 mM DTT for 6 hours and 0.1 mM T6P for the last 3 hours of treatment (F). Autophagosomes were imaged using epifluorescence microscopy and counted. Addition of T6P blocked the activation of autophagy in most conditions. In osmotic stress, autophagy was reduced but not completely blocked by T6P. Different letters denote statistical significance for three biological replicates with at least 10 frames per replicate, p<0.05, t-test. Error bars indicate standard error. (G) Confocal images of roots of GFP-ATG8e-expressing seedlings under control conditions, ER stress and salt stress as representative stresses. The insets show enlargements of the indicated boxes. White arrows point to autophagosomes. Scale bars = 20 μm.
Fig 5
Fig 5. SnRK1 acts upstream of TOR in the autophagy pathway.
(A) WT and kin10 seedlings were grown on ½ MS plates for 7 days. Seedlings were transferred to ½ MS liquid medium supplemented with 10 μM AZD or DMSO for 3 hours, followed by MDC staining. Confocal microscopy was used to visualize autophagosomes (white arrows) in roots. The insets show enlargements of the indicated boxes. Scale bars = 20 μm. (B) Quantification of autophagy activity as shown in (A). Upon inhibition of TOR with AZD, autophagy was still activated in kin10 mutant seedlings. (C) WT and raptor1b seedlings were grown on ½ MS plates for 7 days. Seedlings were transferred to ½ MS liquid medium supplemented with 0.1 mM T6P for 3 hours, followed by MDC staining. Confocal microscopy was used to visualize autophagosomes (white arrows) in roots. The insets show enlargements of the indicated boxes. Scale bars = 20 μm. (D) Quantification of autophagy activity in (C). Upon inhibition of SnRK1 with T6P, autophagy activity was not affected in raptor1b seedlings. (E) GFP-ATG8e seedlings were grown on ½ MS plates for 7 days. Seedlings were transferred to ½ MS liquid medium supplemented with 0.1 mM T6P or 10 μM AZD or T6P plus AZD for 3 hours. Confocal microscopy was used to visualize autophagosomes (white arrows) in roots. The insets show enlargements of the indicated boxes. Scale bars = 20 μm (F) Quantification of autophagosomes labeled with GFP-ATG8e in (E). Upon inhibition of both TOR and SnRK1, autophagy was activated. (G) WT and OE TOR seedlings were grown on ½ MS plates for 7 days. Seedlings were transferred to ½ MS liquid medium supplemented with 10 mM AICAR for 1 hour, followed by MDC staining, and autophagosomes counted. Overexpression of TOR was able to suppress AICAR-induced autophagy. (H) WT, KIN10 OX-1 and KIN10 OX-2 seedlings were grown on ½ MS plates for 7 days. Seedlings were transferred to ½ MS liquid medium supplemented with 20 mM NAA or DMSO for 6 hours, stained with MDC and autophagosomes counted. Activation of TOR by auxin inhibited the constitutive autophagy in KIN10 overexpression lines. (I) Seven-day-old GFP-ATG8e seedlings were transferred to ½ MS liquid medium supplemented with 10 mM AICAR or 20 nM NAA or both AICAR and NAA. Activation of TOR by NAA blocked induction of autophagy by AICAR. For all graphs, different letters denote statistical significance for three biological replicates with at least 10 frames per replicate, p<0.05, t-test. Error bars indicate standard error.

Similar articles

Cited by

References

    1. Yang X, Bassham DC. New Insight into the Mechanism and Function of Autophagy in Plant Cells. Int Rev Cell Mol Biol. 2015;320:1–40. doi: 10.1016/bs.ircmb.2015.07.005 - DOI - PubMed
    1. Tsukada M, Ohsumi Y. Isolation and characterization of autophagy-defective mutants of Saccharomyces cerevisiae. FEBS Lett. 1993;333(1–2):169–74. - PubMed
    1. Thumm M, Egner R, Koch B, Schlumpberger M, Straub M, Veenhuis M, et al. Isolation of autophagocytosis mutants of Saccharomyces cerevisiae. FEBS Lett. 1994;349(2):275–80. - PubMed
    1. Harding TM, Morano KA, Scott SV, Klionsky DJ. Isolation and Characterization of Yeast Mutants in the Cytoplasm to Vacuole Protein Targeting Pathway. J Cell Biol. 1995;131(3):591–602. - PMC - PubMed
    1. Yin Z, Pascual C, Klionsky DJ. Autophagy: machinery and regulation. Microb Cell. 2016;3(12):588–96. doi: 10.15698/mic2016.12.546 - DOI - PMC - PubMed

MeSH terms