Comparative Study
. 2017 Aug 7;18(1):583.
doi: 10.1186/s12864-017-4002-1.

Evaluation and comparison of computational tools for RNA-seq isoform quantification

Affiliations
Comparative Study

Evaluation and comparison of computational tools for RNA-seq isoform quantification

Chi Zhang et al. BMC Genomics. .

Abstract

Background: Alternatively spliced transcript isoforms are commonly observed in higher eukaryotes. The expression levels of these isoforms are key for understanding normal functions in healthy tissues and the progression of disease states. However, accurate quantification of expression at the transcript level is limited with current RNA-seq technologies because of, for example, limited read length and the cost of deep sequencing.

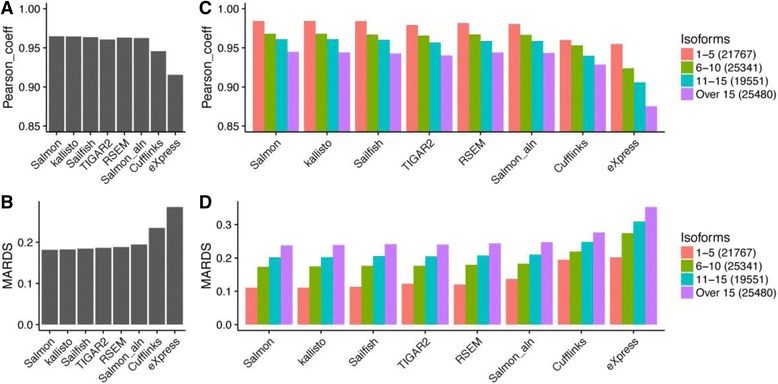
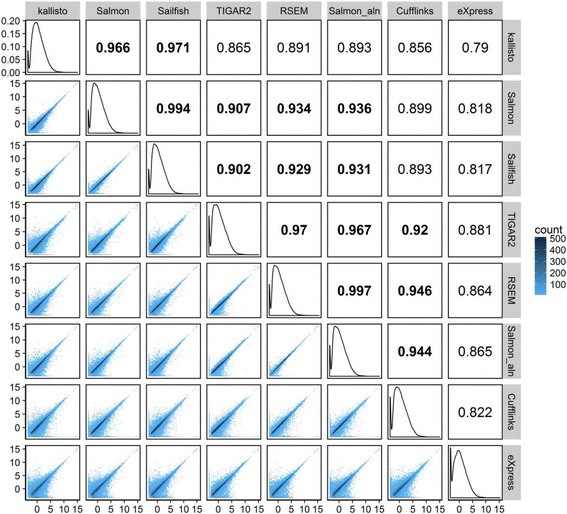
Results: A large number of tools have been developed to tackle this problem, and we performed a comprehensive evaluation of these tools using both experimental and simulated RNA-seq datasets. We found that recently developed alignment-free tools are both fast and accurate. The accuracy of all methods was mainly influenced by the complexity of gene structures and caution must be taken when interpreting quantification results for short transcripts. Using TP53 gene simulation, we discovered that both sequencing depth and the relative abundance of different isoforms affect quantification accuracy CONCLUSIONS: Our comprehensive evaluation helps data analysts to make informed choice when selecting computational tools for isoform quantification.

Keywords: Data analysis; Isoform; Kallisto; Quantification; RNA-seq; RSEM; Salfish; Salmon.


Conflict of interest statement

Ethics approval and consent to participate

Not applicable.

Consent for publication

Not applicable.

Competing interests

The authors declare that they have no competing interests.

Publisher’s Note

Springer Nature remains neutral with regard to jurisdictional claims in published maps and institutional affiliations.

Figures

Fig. 1
Fig. 1
Workflow for transcript isoform quantification. Sequencing reads were either mapped by STAR aligner or directly fed into alignment-free methods, Salmon, Sailfish or Kallisto. The transcriptome BAM files were quantified by Salmon_aln, eXpress, RSEM or TIGAR2. The genome BAM files were quantified by Cuffquant and then Cuffnorm from the Cufflinks package. The results are summarized into counts and TPM tables for comparison
Fig. 2
Fig. 2
Comparisons of the overall performance among different methods and the impact of the number of transcripts on the accuracy of isoform quantification. a Pearson correlation coefficient. b mean absolute relative differences and c-d) The above metrics were broken into separate groups according to the number of annotated transcript isoforms for each gene. The number of transcripts in each group is shown in figure legends. The accuracy metrics were calculated by comparing the estimated counts with the “ground truths” in simulated dataset
Fig. 3
Fig. 3
Inconsistency in effective length calculation among methods for short transcripts. a Read counts were estimated correctly for the transcript SNHG25–002. b Methods showed disagreement in estimating TPM values for the same transcript. c The relationship between the effective transcript length estimated by each method and the corresponding transcript length. Only transcripts with length less than 400 nt are shown. Note the transcript length at x-axis is the total number of nucleotides of the transcript in the Gencode Release v25
Fig. 4
Fig. 4
Correlation of estimated TPM values for all transcripts between technical replicates of experimental datasets. a UHRR-C1 (x-axis) and UHRR-C2 (y-axis). b HBRR-C4 (x-axis) and HBRR-C6 (y-axis). The R 2 value is shown in each figure. Note, x and y-axes represent log2 transformed estimated transcript TPM values
Fig. 5
Fig. 5
Pairwise correlation of estimated TPM values for all transcripts between methods for the HBRR-C4 sample. The distribution of transcripts’ TPMs from each method was plotted on the diagonal panels. Pairwise density plots and R 2 values are shown in the lower and upper triangular panels, respectively. R 2 values over 0.9 are in bold. Methods are grouped using hierarchical clustering
Fig. 6
Fig. 6
Significant difference in estimated read counts for transcript RPS28P7–001 resulting from STAR aligner. A total of 154 reads for RPS28P7–001 were simulated. a The estimated read counts from all eight methods are shown, and they are severely underestimated by the methods using STAR aligner. b The read coverage profiles (coloured in red) in RPS28P7–001 and RPS28–001. The peak paired-end read counts (both ends counted) are shown in brackets. Only a small fraction of reads were mapped back to the RPS28P7 region while the majority of reads were incorrectly mapped to the RPS28 gene
Fig. 7
Fig. 7
The impact of sequencing depth and relative abundance on the accuracy of isoform quantification. a Structures of six canonical transcripts of the TP53 gene, and their corresponding identifier in GENCODE v25. b The accuracy of isoform quantification with each of the seven methods under each simulation condition. MARDS was calculated using known and estimated read counts

References

    1. Wang ET, Sandberg R, Luo S, Khrebtukova I, Zhang L, Mayr C, Kingsmore SF, Schroth GP, Burge CB. Alternative isoform regulation in human tissue transcriptomes. Nature. 2008;456(7221):470–476. doi: 10.1038/nature07509. - DOI - PMC - PubMed
    1. Harrow J, Frankish A, Gonzalez JM, Tapanari E, Diekhans M, Kokocinski F, Aken BL, Barrell D, Zadissa A, Searle S, et al. GENCODE: the reference human genome annotation for the ENCODE project. Genome Res. 2012;22(9):1760–1774. doi: 10.1101/gr.135350.111. - DOI - PMC - PubMed
    1. Trapnell C, Williams BA, Pertea G, Mortazavi A, Kwan G, van Baren MJ, Salzberg SL, Wold BJ, Pachter L. Transcript assembly and quantification by RNA-Seq reveals unannotated transcripts and isoform switching during cell differentiation. Nat Biotechnol. 2010;28(5):511–515. doi: 10.1038/nbt.1621. - DOI - PMC - PubMed
    1. Batra R, Charizanis K, Manchanda M, Mohan A, Li M, Finn DJ, Goodwin M, Zhang C, Sobczak K, Thornton CA, et al. Loss of MBNL leads to disruption of developmentally regulated alternative polyadenylation in RNA-mediated disease. Mol Cell. 2014;56(2):311–322. doi: 10.1016/j.molcel.2014.08.027. - DOI - PMC - PubMed
    1. de Klerk E, Venema A, Anvar SY, Goeman JJ, Hu O, Trollet C, Dickson G, den Dunnen JT, van der Maarel SM, Raz V, et al. Poly (a) binding protein nuclear 1 levels affect alternative polyadenylation. Nucleic Acids Res. 2012;40(18):9089–9101. doi: 10.1093/nar/gks655. - DOI - PMC - PubMed

MeSH terms