

Estimation of malaria parasite reservoir coverage using reactive case detection and active community fever screening from census data with rapid diagnostic tests in southern Zambia: a re-sampling approach
- PMID: 28784122
- PMCID: PMC5547485
- DOI: 10.1186/s12936-017-1962-1
Estimation of malaria parasite reservoir coverage using reactive case detection and active community fever screening from census data with rapid diagnostic tests in southern Zambia: a re-sampling approach
Abstract
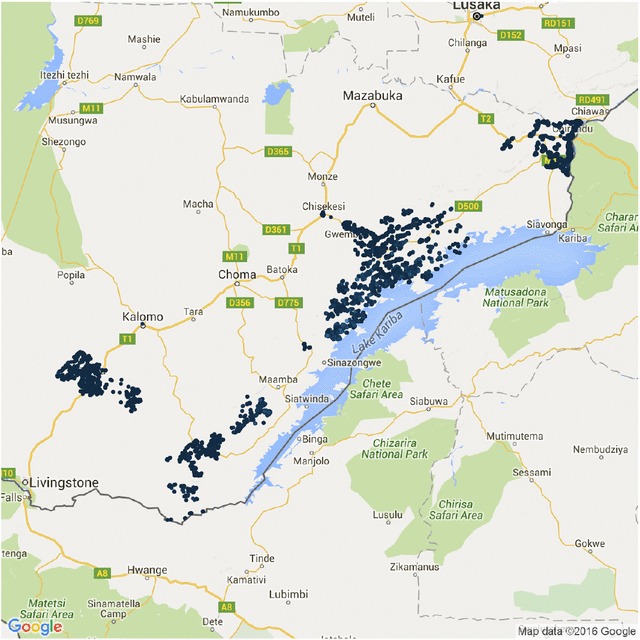
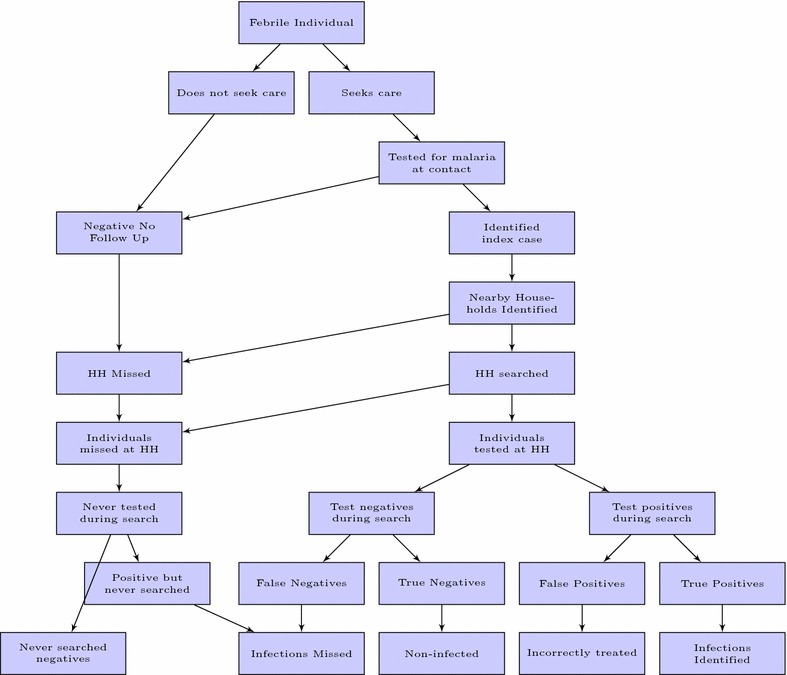
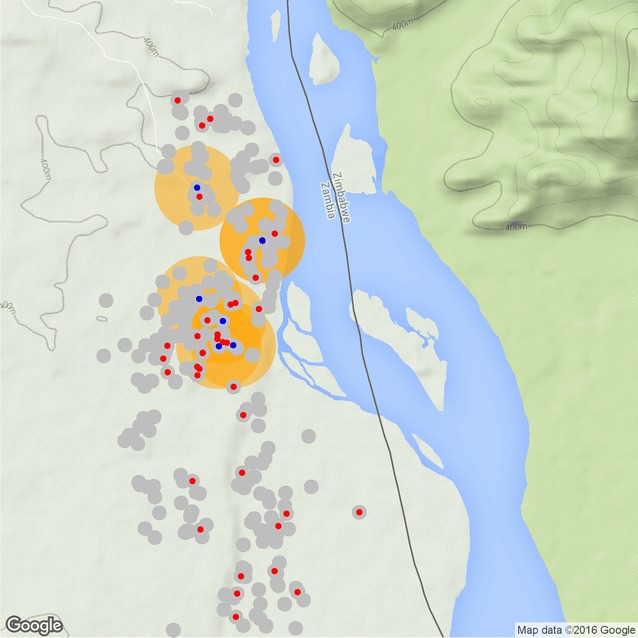
Background and methods: In areas where malaria transmission has been suppressed by vector control interventions many malaria control and elimination programmes are actively seeking new interventions to further reduce malaria prevalence, incidence and transmission. Malaria infection prevalence and incidence has been shown to cluster geographically, especially at lower transmission levels, and as such a reactive strategy is frequently used, by which index cases presenting to a passive surveillance system are used to target small areas for testing and treatment, reactive case detection (RCD), or focal drug administration (fDA). This study utilizes geo-located data from a census with parasitological testing with rapid diagnostic tests (RDTs) and treatment-seeking data collection conducted in southern Zambia to estimate the coverage of RCD or fDA in terms of the population and parasite reservoir as well as the operational requirements of such strategies, using a re-sampling algorithm developed exclusively for this purpose. This re-sampling algorithm allows for the specification of several parameters, such that different operational variants of these reactive strategies can be examined, including varying the search radius, screening for fever, or presumptive treatment (fDA).
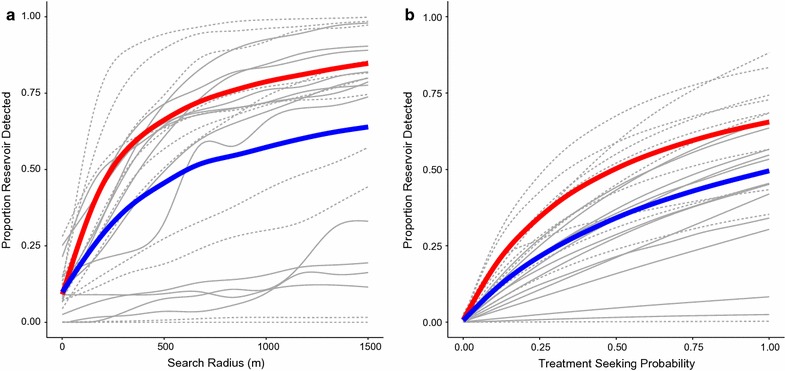
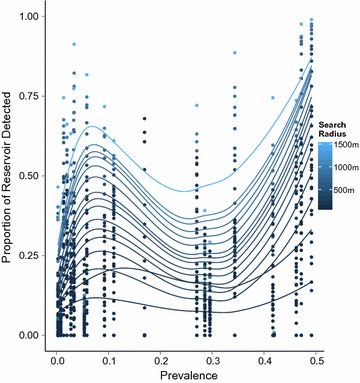
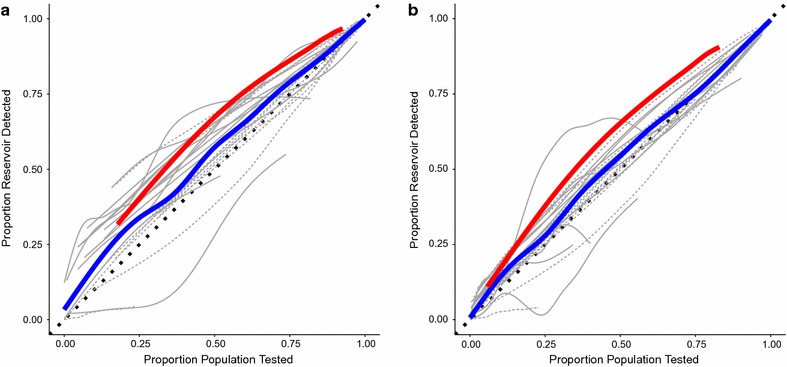
Results: Results indicate that RCD, fDA and active fever screening followed by RCD, even with search radii over several hundered meters will only yield limited coverage of the RDT positive parasite reservoir during a short period. Long-term use of these strategies may increase this proportion. Reactive strategies detect a higher proportion of the reservoir of infections than random searches, but this effect appears to be greater in areas of low, but not moderate malaria prevalence in southern Zambia.
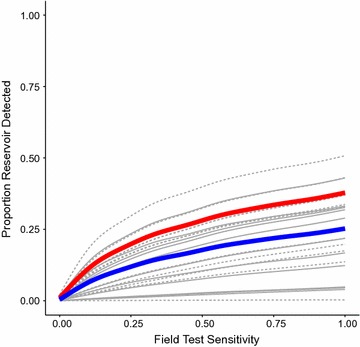
Discussion: Increases in the sensitivity of RDTs could also affect these results. The number of individuals and households that need to be searched increase rapidly, but approximately linearly with search radius.
Conclusions: Reactive strategies in southern Zambia yield improved identification of the parasite reservoir when targeted to areas with prevalence less than 10%. The operational requirements of delivering reactive strategies routinely are likely to prevent their uptake until prevalence falls far below this level.
Keywords: Active community fever screening; Case detection; Fever screening; Malaria; Reactive case detection; Resampling.
Figures
References
-
- Pinchoff J, Henostroza G, Carter BS, Roberts ST, Hatwiinda S, Hamainza B, Hawela M, Curriero FC. Spatial patterns of incident malaria cases and their household contacts in a single clinic catchment area of Chongwe District, Zambia. Malar J. 2015;14(1):305. doi: 10.1186/s12936-015-0793-1. - DOI - PMC - PubMed
-
- Stresman GH, Baidjoe AY, Stevenson J, Grignard L, Odongo W, Owaga C, Osoti V, Makori E, Shagari S, Marube E, Cox J, Drakeley C, Bousema T. Focal Screening to Identify the Subpatent Parasite Reservoir in an Area of Low and Heterogeneous Transmission in the Kenya Highlands. J Infect Dis. 2015;212(11):1768–1777. doi: 10.1093/infdis/jiv302. - DOI - PubMed
-
- Greenhalgh D. Optimal control of an epidemic by ring vaccination. Commun Stat Stoch Models. 1986;2(3):339–363. doi: 10.1080/15326348608807041. - DOI
-
- Hustedt J, Canavati SE, Rang C, Ashton RA, Khim N, Berne L, Kim S, Sovannaroth S, Ly P, Ménard D, Cox J, Meek S, Roca-Feltrer A. Reactive case-detection of malaria in Pailin Province, Western Cambodia: lessons from a year-long evaluation in a pre-elimination setting. Malar J. 2016;15(1):132. doi: 10.1186/s12936-016-1191-z. - DOI - PMC - PubMed
MeSH terms
Substances
LinkOut - more resources
Full Text Sources
Other Literature Sources
Medical
