Review
. 2017 Nov:189:1-12.
doi: 10.1016/j.trsl.2017.07.006. Epub 2017 Jul 22.

Large-scale 3-dimensional quantitative imaging of tissues: state-of-the-art and translational implications

Affiliations
Review

Large-scale 3-dimensional quantitative imaging of tissues: state-of-the-art and translational implications

Seth Winfree et al. Transl Res. 2017 Nov.

Abstract

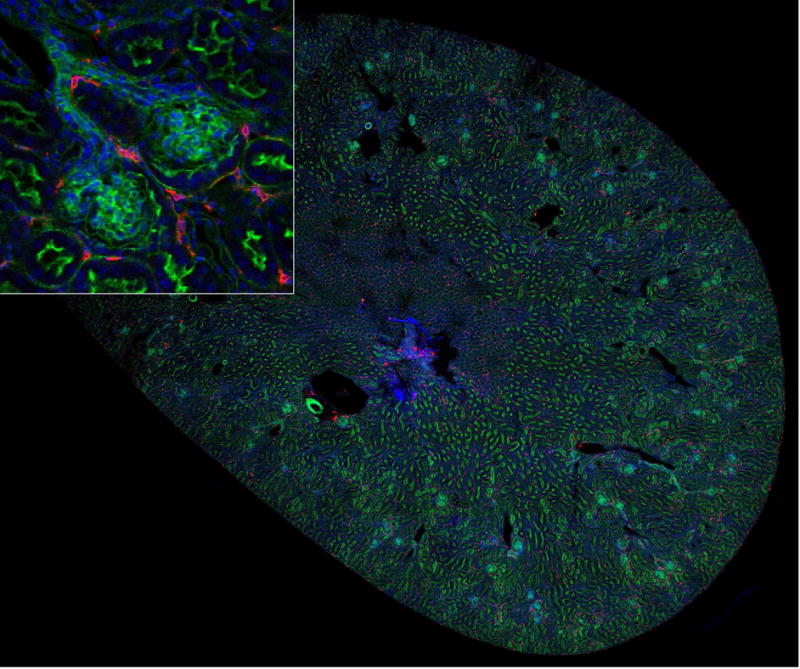
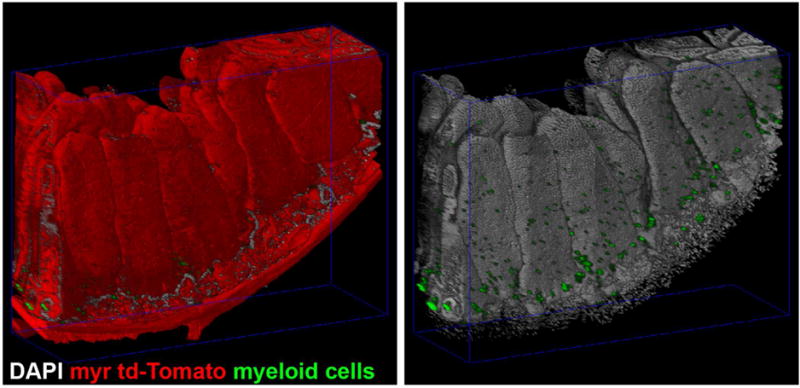
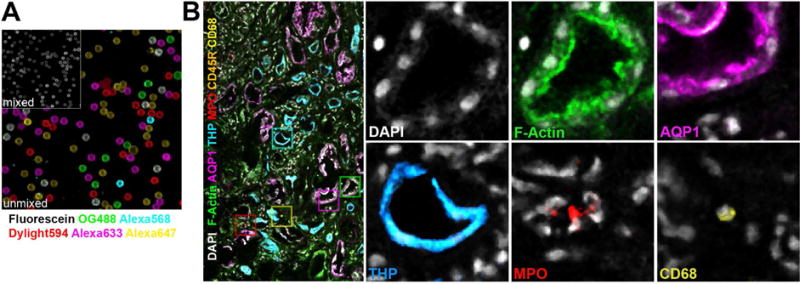
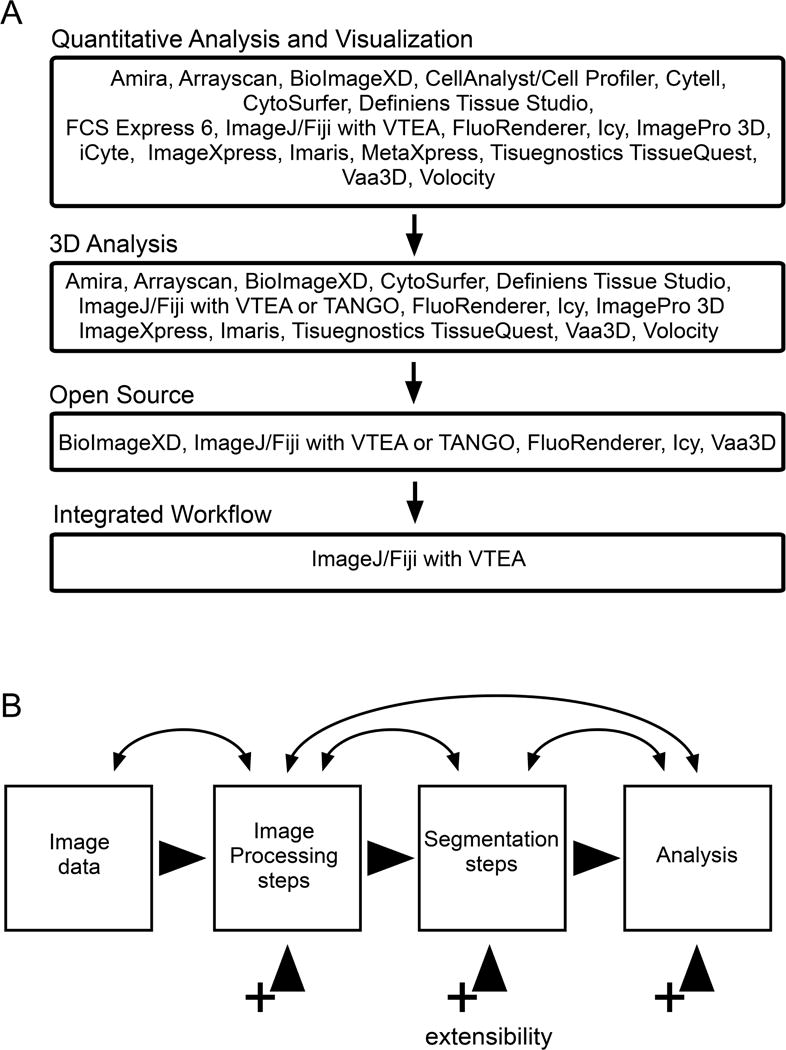
Recent developments in automated optical sectioning microscope systems have enabled researchers to conduct high resolution, three-dimensional (3D) microscopy at the scale of millimeters in various types of tissues. This powerful technology allows the exploration of tissues at an unprecedented level of detail, while preserving the spatial context. By doing so, such technology will also enable researchers to explore cellular and molecular signatures within tissue and correlate with disease course. This will allow an improved understanding of pathophysiology and facilitate a precision medicine approach to assess the response to treatment. The ability to perform large-scale imaging in 3D cannot be realized without the widespread availability of accessible quantitative analysis. In this review, we will outline recent advances in large-scale 3D imaging and discuss the available methodologies to perform meaningful analysis and potential applications in translational research.


Conflict of interest statement

Conflict of Interest statement: The authors declare no conflict of interests, and all authors have read the journal’s policy on disclosure of potential conflicts of interest.

Figures

Figure 1
Figure 1. Mosaic of 80 image volumes collected from a mouse kidney thick section
A 50 μm section of mouse kidney was cut with a vibratome and stained for nuclei (DAPI,blue), F-actin (green), and with an antibody against MHCII (red). Image volumes were collected using a 20X, NA 0.75 Leica objective on a Leica SP8 confocal microscope and mosaic merged in Fiji. Image field is 6 mm across. Inset – magnified region showing MHCII cells adjacent to two glomeruli.
Figure 2
Figure 2. Tissue clearing and imaging of mesoscale 3D specimen generates complex, high resolution volumes
Intestine from FLT3Cre+; ROSA26mTmG/mTmG mice expressing myristoylated-td-Tomato(myr td-Tomato, red) and GFP in myeloid cells(myeloid cells, green) were dissected, stained for nuclei(DAPI, gray) and cleared with Triton X-100 in phosphate buffered saline. Multiple overlapping volumes were imaged by confocal laser scanning microscopy and mosaic merged. At left, DNA and GFP are shown to demonstrate the number and complexity of the enterocytes and intercalated myeloid cells.
Figure 3
Figure 3. Spectral unmixing of seven labels in a human kidney biopsy volume
Beads and the biopsy were labeled with seven fluorophores. Multiple overlapping confocal volumes of the human biopsy were collected and mosaic merged. Spectra from the independently labeled beads were used to spectrally unmix the seven fluorophores with LASX(Leica). (A) Secondary antibodies independently absorbed to latex beads were combined and then spectrally unmixed with reference spectra. Reference spectra were collected from individually labeled beads. (B) Human biopsies were stained for nuclei (DAPI, gray), F-actin (phalloidin-Oregon Green 488, green) and species specific secondary antibodies labeled with Dylight594, Alexa647, Fluorescein, Alexa633 and Alexa568 were used to label primary antibodies against myeloperoxidase (MPO, red), macrophages (CD68, yellow), B-cells (CD45R, orange), Aquaporin-1(AQP1, magenta) and Tamm-Horsfall Protein (THP, cyan).
Figure 4
Figure 4. Available tools with integrated 3D tissue cytometry workflow
(A) VTEA provides the most comprehensive and easy-to-use open source tool for tissue cytometry. (B) VTEA was designed to support extensibility and a bidirectional workflow. A bidirectional workflow supports and encourages an iterative refinement of image processing and segmentation to facilitate accurate quantitative analyses. A common interface and workflow for tissue cytometry will enable reproducible user interaction and results. Extensibility is available or planned for the three major components of VTEA: image processing, segmentation and analysis (visualization). This will allow for the incorporation of new approaches in the developing field of image processing and segmentation and to address new challenges.
Figure 5
Figure 5. Six channel 3D mesoscale imaging and analysis of a human nephrectomy section by tissue cytometry
(A) Human nephrectomy was stained for nuclei (DAPI, gray), F-actin (phalloidin-Oregon Green 488, green), myeloperoxidase (MPO, red), macrophages (CD68, yellow), Aquaporin-1(AQP1, magenta) and Tamm-Horsfall Protein (THP, cyan) and with species specific secondary antibodies labeled with Dylight594, Alexa647, Fluorescein, Alexa633 and Alexa568 respectively. Multiple overlapping volumes were imaged by confocal laser scanning microscopy, spectrally unmixed and mosaic merged. Spectral unmixing was performed with single fluorophore labeled beads as references. (B) Merged and unmixed image was analyzed by VTEA and CD68 and MPO positive cells were quantified. At right, gates were drawn on scatter plot in VTEA to identify CD68+ and MPO+ cells (yellow and red gates respectively). Left, these cells were mapped to the original volume, a maximum projection is shown (as indicated in yellow, CD68+ and red, MPO+). At lower right, a portion of the volume is rendered by Voxx in 3D with nuclei (gray), myeloperoxidase (MPO, red) and gated nuclei/cells (magenta). Scale bar = 500 μm. This image was used with permission from the Journal of the American Society of Nephrology (Cover July 2017).
Figure 6
Figure 6. Quantifying the spatial density of infiltrating neutrophils
3D imaging and analysis of a biopsy stained for nuclei (DAPI, gray), F-actin (phalloidin,green) and myeloperoxidase (MPO, red). (A) Scatter plot showing all cells with their associated F-actin and MPO staining. A gate for MPO positive cells is indicated by the yellow rectangle. (B) Representative 3D rendering with image data for DAPI, F-actin, MPO and an overlay (yellow) mapping the nuclei of MPO+ cells gated in A directly on the image volume. Proximal tubules (cyan arrowheads) and a glomerulus (G) are indicated. (C) Region-of-interest (ROI) interrogation of the image volume determines neutrophil density around different tubule segments. In this example, there was ten times more neutrophils around PT contiguous to a glomerulus (<100 μm distance) vs. non-contiguous PT (ROI1 vs ROI2, respectively). Scale bar = 100 μm.
Figure 7
Figure 7. Kidney injury induced signaling quantified in 3D by tissue cytometry
(A)-Z-projection of a 50μm-thick image volume from the kidney of a mouse 6 hrs after ischemia-reperfusion injury, stained for DAPI (cyan), F-Actin (green) and p-c-Jun (red). (B) VTEA scatterplot of nucleated cells, with a gate (in yellow) for cells with nuclear (activated) c-Jun. (C) Volume rendering of panel A. (D) Volume rendering with gated cells as given in B, indicated in yellow.

Similar articles

Cited by

References

    1. Furness PN, Philpott CM, Chorbadjian MT, Nicholson ML, Bosmans JL, Corthouts BL, et al. Protocol biopsy of the stable renal transplant: a multicenter study of methods and complication rates. Transplantation. 2003;76:969–73. - PubMed
    1. Hiemann NE, Wellnhofer E, Knosalla C, Lehmkuhl HB, Stein J, Hetzer R, et al. Prognostic impact of microvasculopathy on survival after heart transplantation: evidence from 9713 endomyocardial biopsies. Circulation. 2007;116:1274–82. - PubMed
    1. Bartlett JM, Brookes CL, Robson T, van de Velde CJ, Billingham LJ, Campbell FM, et al. Estrogen receptor and progesterone receptor as predictive biomarkers of response to endocrine therapy: a prospectively powered pathology study in the Tamoxifen and Exemestane Adjuvant Multinational trial. J Clin Oncol. 2011;29:1531–8. - PMC - PubMed
    1. Harvey JM, Clark GM, Osborne CK, Allred DC. Estrogen receptor status by immunohistochemistry is superior to the ligand-binding assay for predicting response to adjuvant endocrine therapy in breast cancer. J Clin Oncol. 1999;17:1474–81. - PubMed
    1. Harris L, Fritsche H, Mennel R, Norton L, Ravdin P, Taube S, et al. American Society of Clinical Oncology 2007 update of recommendations for the use of tumor markers in breast cancer. J Clin Oncol. 2007;25:5287–312. - PubMed