. 2017 Aug 22;114(34):9104-9109.
doi: 10.1073/pnas.1711645114. Epub 2017 Aug 7.

Chaperonin GroEL accelerates protofibril formation and decorates fibrils of the Het-s prion protein

Affiliations

Chaperonin GroEL accelerates protofibril formation and decorates fibrils of the Het-s prion protein

Marielle A Wälti et al. Proc Natl Acad Sci U S A. .

Abstract

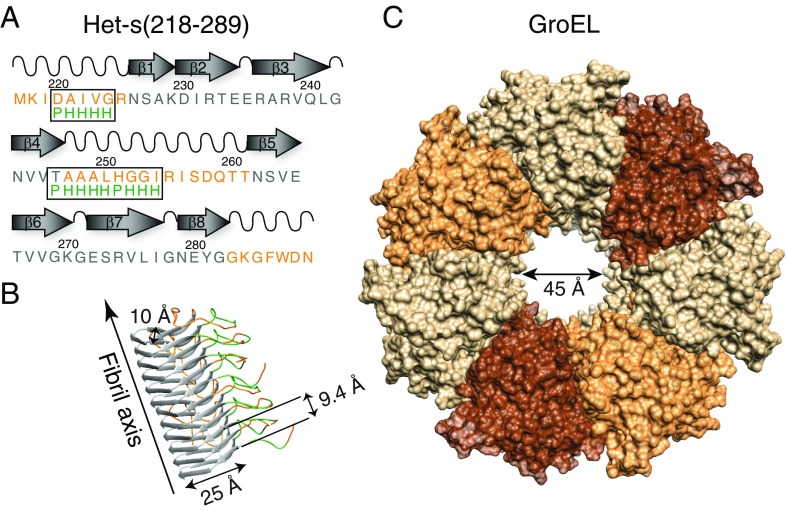
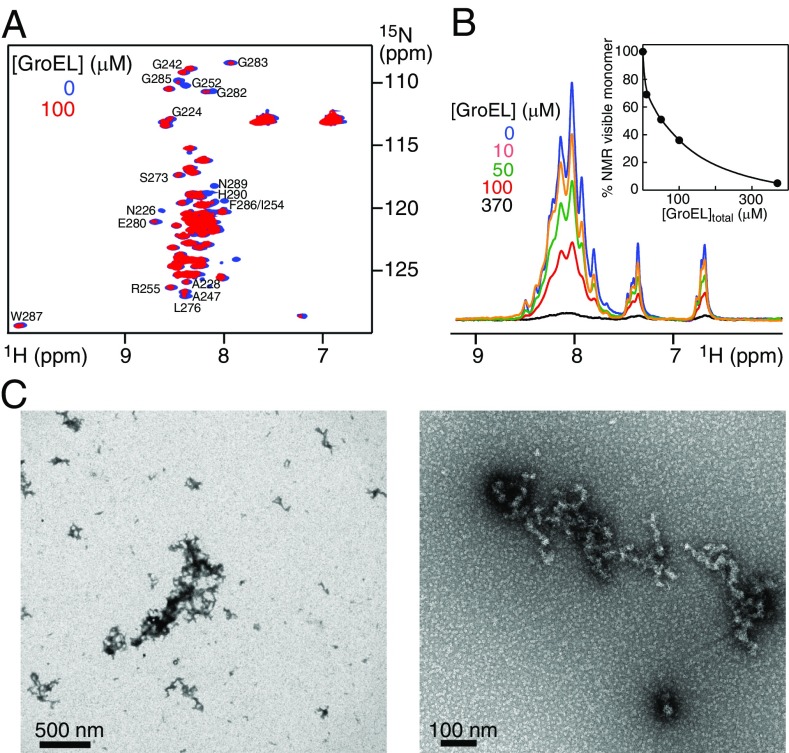
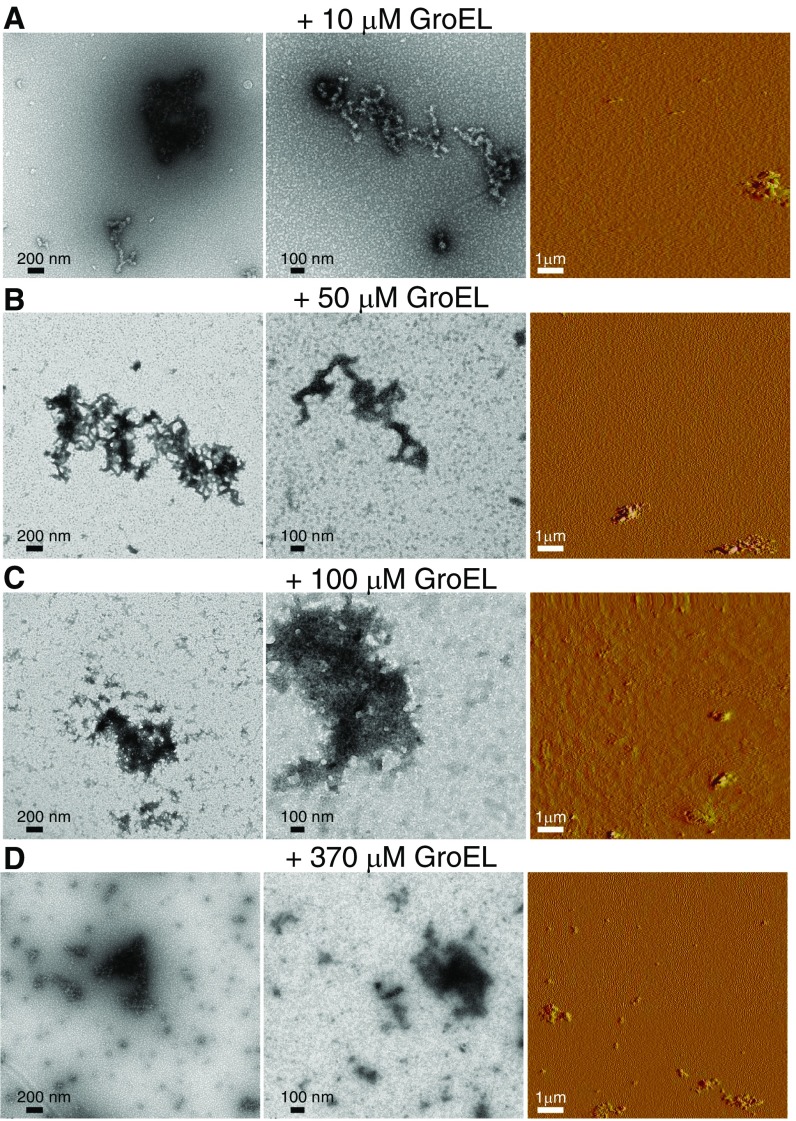
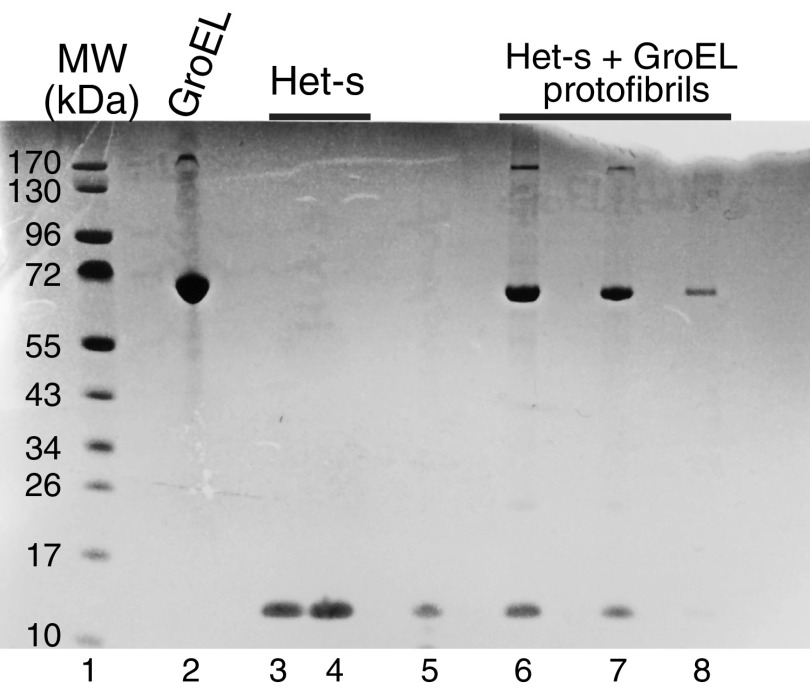
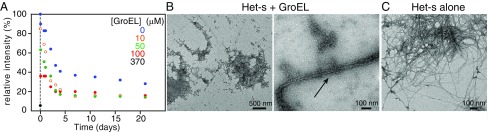
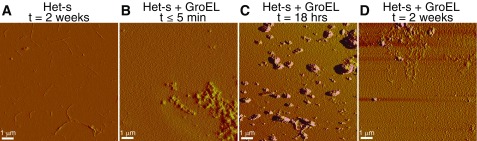
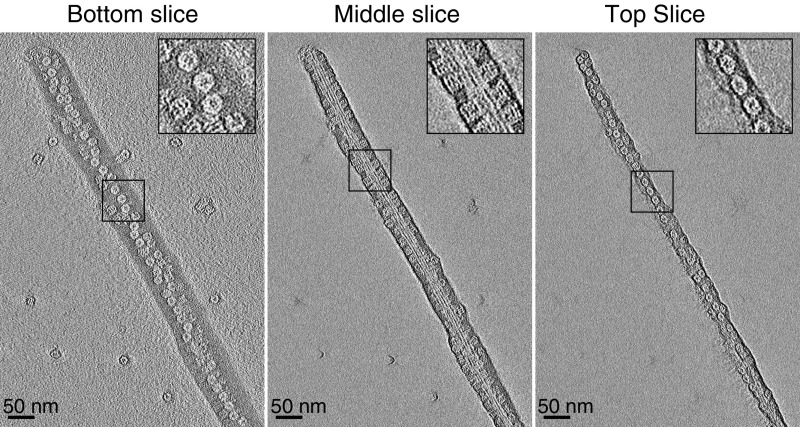
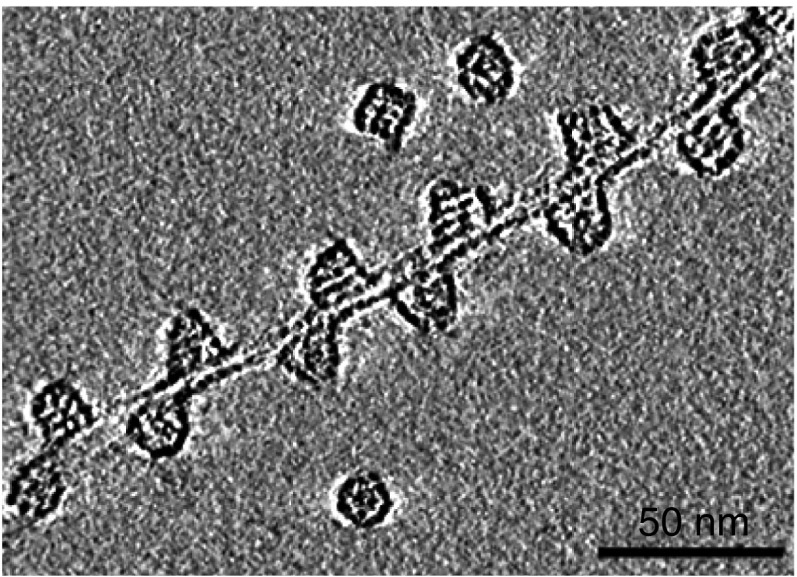
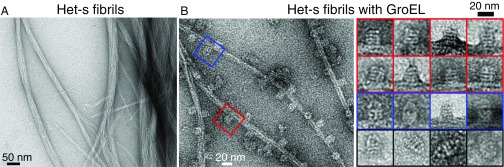
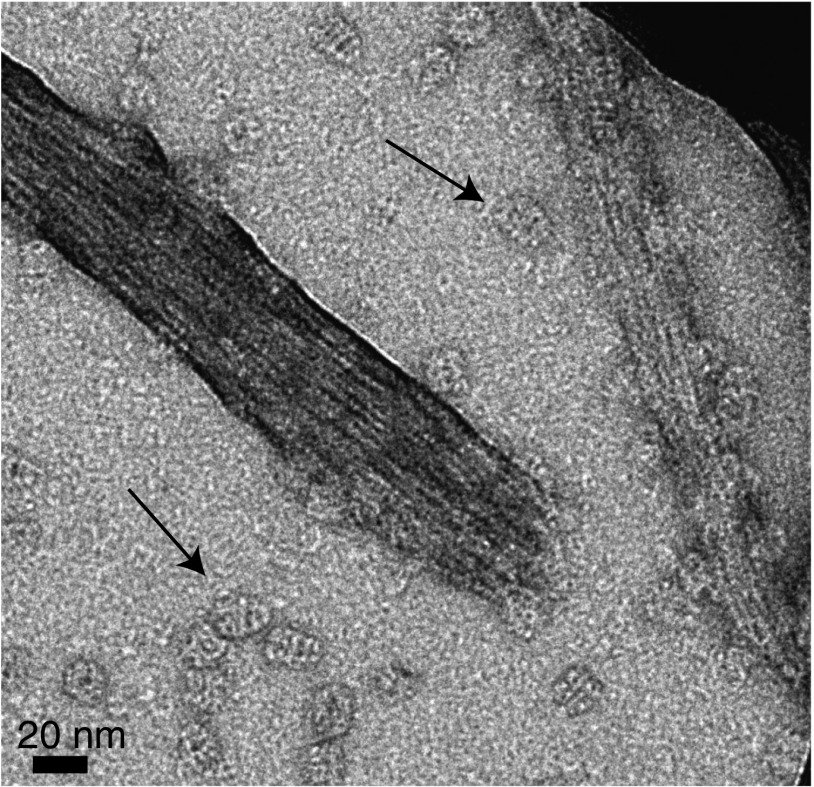
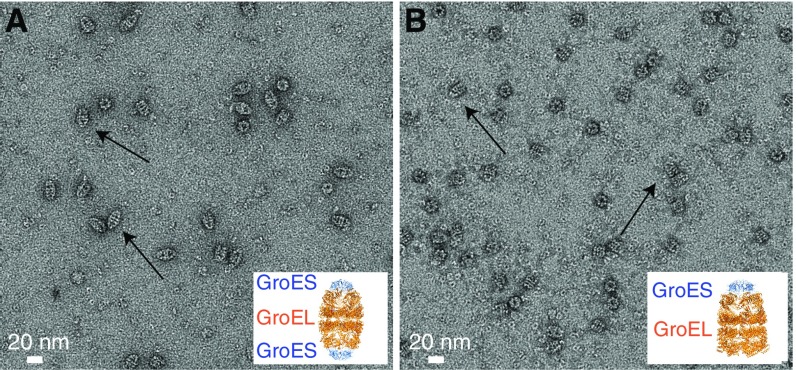
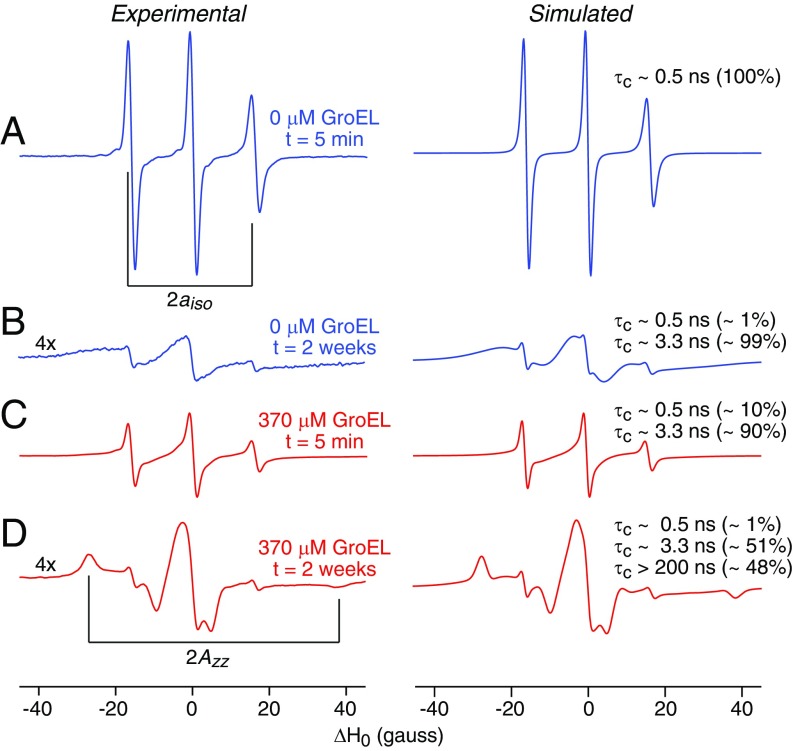
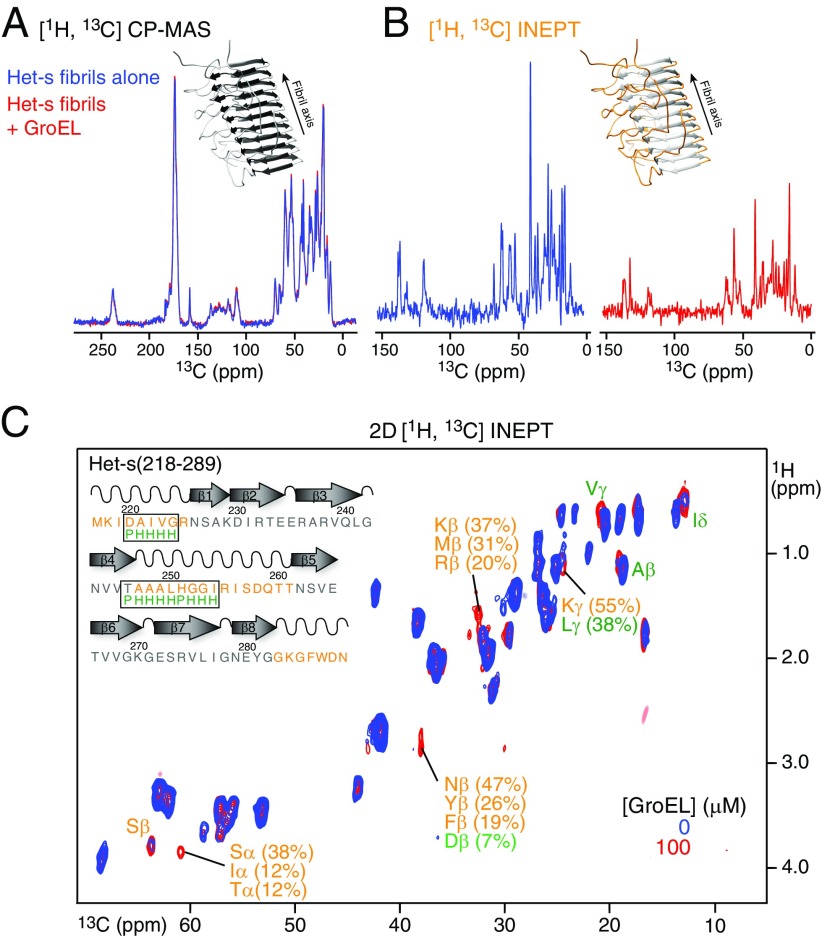
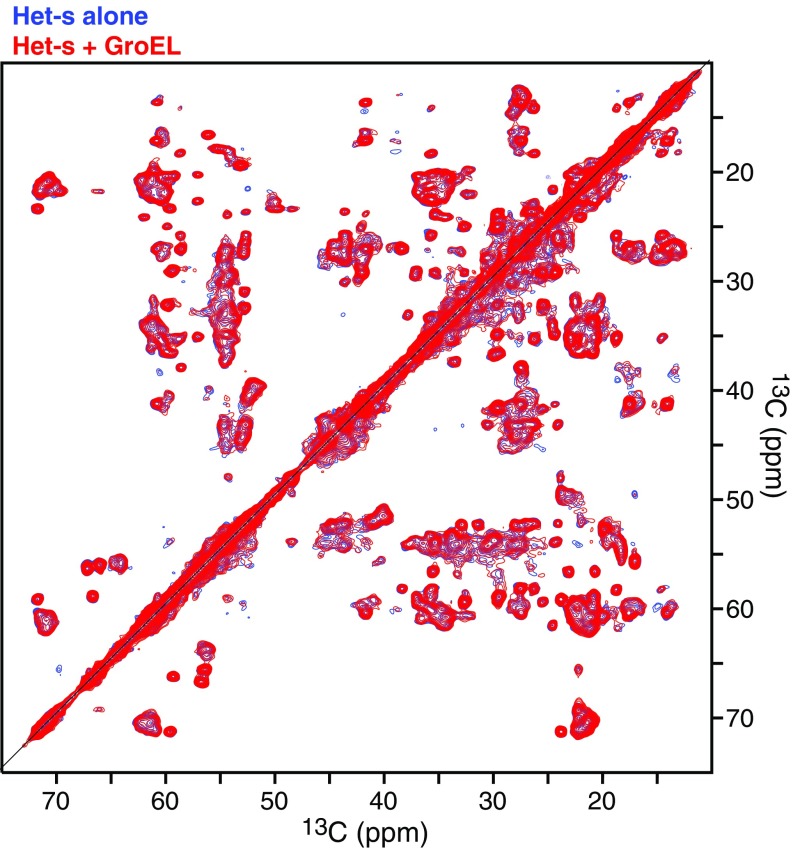
We have studied the interaction of the prototypical chaperonin GroEL with the prion domain of the Het-s protein using solution and solid-state NMR, electron and atomic force microscopies, and EPR. While GroEL accelerates Het-s protofibril formation by several orders of magnitude, the rate of appearance of fibrils is reduced. GroEL remains bound to Het-s throughout the aggregation process and densely decorates the fibrils at a regular spacing of ∼200 Å. GroEL binds to the Het-s fibrils via its apical domain located at the top of the large open ring. Thus, apo GroEL and bullet-shaped GroEL/GroES complexes in which only a single ring is capped by GroES interact with the Het-s fibrils; no evidence is seen for any interaction with football-shaped GroEL/GroES complexes in which both rings are capped by GroES. EPR spectroscopy shows that rotational motion of a nitroxide spin label, placed at the N-terminal end of the first β-strand of Het-s fibrils, is significantly reduced in both Het-s/GroEL aggregates and Het-s fibrils, but virtually completely eliminated in Het-s/GroEL fibrils, suggesting that in the latter, GroEL may come into close proximity to the nitroxide label. Solid-state NMR measurements indicate that GroEL binds to the mobile regions of the Het-s fibril comprising the N-terminal tail and a loop connecting β-strands 4 and 5, consistent with interactions involving GroEL binding consensus sequences located therein.

Keywords: EPR; NMR; amyloid–chaperone interactions; atomic force microscopy; electron microscopy.


Conflict of interest statement

The authors declare no conflict of interest.

Figures

Fig. 1.
Fig. 1.
Het-s(218–289) and GroEL. (A) Primary and secondary structure of Het-s(218–289) fibrils. Sequences within the flexible tails and loop are colored in orange, and the sites of GroEL-binding consensus sequences (a polar residue, P, followed by four hydrophobic residues, H) are indicated in green. (Note the N-terminal methionine is not part of the natural Het-s sequence.) (B) Structure of the Het-s(218–289) fibril determined by solid-state NMR (PDB ID code 2KJ3; ref. 9). (C) Structure of apo GroEL (PDB ID code 1XCK; ref. 41) showing a single heptameric ring viewed orthogonal to the long axis of the cavity. The structures in B and C are drawn to scale. Four to five Het-s(218–289) termini can potentially bind within each GroEL cavity.
Fig. 2.
Fig. 2.
GroEL concentration-dependent aggregation of Het-s(218–289) at time point zero. (A) 1H-15N HSQC spectra of 100 μM Het-s(218–289) alone (blue) and immediately after addition of 100 μM (in subunits) GroEL (red). (B) First increment of 1H-15N HSQC spectra acquired on 100 μM Het-s(218–289) in the presence of 0–370 μM (in subunits) GroEL at time point zero (i.e., recorded immediately after addition of GroEL). Inset shows a plot of the fractional decrease in NMR visible monomer as a function of total GroEL concentration (in subunits). (C) Electron micrographs of the Het-s aggregates (protofibrils, 100 μM in monomer units) formed immediately after addition of 100 μM (in subunits) GroEL at room temperature. In the same time frame, no aggregates/protofibrils are observed in the absence of GroEL addition.
Fig. S1.
Fig. S1.
Negative stain electron micrographs (Left and Center) and amplitude AFM images (Right) of Het-s protofibrils obtained immediately after addition of GroEL at different concentrations. Ten (A), 50 (B), 100 (C), and 370 (D) micromolar (in subunits) GroEL was added to 100 μM Het-s(218–289) monomer.
Fig. S2.
Fig. S2.
Characterization of GroEL, Het-s, and Het-s/GroEL protofibrils by Coomassie-stained SDS/PAGE (4–12% wt/vol). Lane 1, molecular mass standards; lane 2, 10 μM (in subunits) GroEL (subunit theoretical molecular mass = 57.1 kDa); lanes 3 and 4, 10 and 20 μM Het-s(218–289) (theoretical molecular mass = 8.7 kDa), respectively; lane 5, supernatant after spinning down protofibrils obtained 5 min after addition of 100 μM (in subunits) GroEL to 100 μM Het-s; lanes 6–8, pelleted protofibrils (obtained 5 min after addition of 100 μM in subunits GroEL to 100 μM Het-s) dissolved in SDS loading buffer at concentrations of 7, 4, and 2 μM, respectively, in GroEL (subunit concentration) and Het-s in a 1:1 ratio.
Fig. 3.
Fig. 3.
Time dependence of Het-s(218–289) aggregation following addition of GroEL. (A) Disappearance of 100 μM Het-s(218–289) monomer over time as a function of GroEL concentration (specified in subunits), measured by solution-state NMR. (B) Electron micrographs of GroEL-induced Het-s protofibrils (Left) and fibrils (arrow, Right) obtained 11 d following the addition of 370 μM (in subunits) GroEL to 100 μM monomeric Het-s(218–289) at room temperature under quiescent conditions. (C) Het-s(218–289) fibrils obtained with 100 μM Het-s(218–289) alone at room temperature after 11 d under quiescent conditions.
Fig. S3.
Fig. S3.
Amplitude AFM images of Het-s protofibril/fibril formation over time in the absence and presence of GroEL. (A) Het-s(218-29) fibrils (100 μM in monomer) formed after 2 wk at room temperature. Het-s(218–289) protofibrils and fibrils (100 μM in monomer) obtained immediately (B), after 18 h (C), and after 2 wk (D) following the addition of 370 μM (in subunits) GroEL. In B and C, only protofibils are present; but after 2 wk (C), both fibrils and profibrils are clearly observed. Fibrilization was carried out at room temperature under quiescent conditions.
Fig. 4.
Fig. 4.
Negative stain electron tomogram images of Het-s fibrils 3 wk after addition of 100 μM (in subunits) GroEL to 100 μM monomeric Het-s(218–289) at room temperature under quiescent conditions. All three slices clearly show that GroEL binds via its apical domain to the Het-s(218–289) fibrils. Insets show a zoom of a region of interest (black box).
Fig. 5.
Fig. 5.
Regular spacing of GroEL bound via its apical domain to a Het-s monofilament. Shown is the middle slice of a negative stain electron tomogram image of a Het-s fibril formed 3 wk after addition of 100 μM (in subunits) GroEL to 100 μM Het-s(218–289) at room temperature under quiescent conditions. Also seen are three unbound GroEL molecules.
Fig. 6.
Fig. 6.
Negative stain electron micrographs of Het-s fibrils formed in the absence (A) and presence (B) of GroEL and GroES. Most of the GroEL bound to Het-s is in the uncapped form (red box); however, some bullet-shaped GroEL/GroES complexes are also bound to the Het-s fibrils (blue box). Right images show a collection of enlarged micrographs of differently prepared samples where uncapped bound GroEL (first and second rows, red), bullet-shaped bound GroEL/GroES complexes (third row, blue), and unbound football-shaped GroEL/GroES complexes (fourth row, black) are found. One hundred micromolar Het-s(218–289) was fibrilized for 3 wk at room temperature under quiescent conditions. Bullet- or football-shaped GroEL/GroES complexes (prepared as described in Experimental Methods) were mixed separately with Het-s fibrils leading to micrographs shown in the blue or black boxes (B, Right), respectively (see also Fig. S5).
Fig. S5.
Fig. S5.
Negative stain EM of Het-s fibrils in the presence of football-shaped GroEL/ES complexes. Most of the GroEL is still uncapped and bound to the fibrils; football-shaped GroEL/ES complexes can be clearly seen (typical examples are indicated by arrows) and are never observed bound to the fibrils. Het-s (100 μM monomer) was fibrilized at room temperature under quiescent conditions. Football-shaped GroEL/GroES complex (prepared as described in Experimental Methods) were added directly to the fibrils.
Fig. S4.
Fig. S4.
Negative stain electron micrographs of 100 μM (in subunits) GroEL capped with 100 μM (in subunits) GroES. (A) Bullet-shaped GroEL complexes (one end capped by GroES) formed upon addition of ADP. (B) Football-shaped GroEL/GroES complexes (both ends capped by GroES) formed upon addition of ATP. Typical examples are indicated by arrows in both A and B. Insets in A and B show the X-ray structures of the football-shaped (PDB ID code 4PKN; refs. and 46) and bullet-shaped (PDB ID code 1SX4; ref. 45) GroEL/GroES complexes, respectively. Details regarding the assembly of the two GroEL/GroES complexes are given in Experimental Methods.
Fig. 7.
Fig. 7.
Comparison of experimental and simulated CW X-band EPR spectra of MTSL-labeled Het-s (S227C) in different states. (A) Monomeric Het-s. (B) Het-s fibrils were obtained after 2 wk at room temperature, centrifuged, and the pellet was resuspended in water (C) Het-s protofibrils obtained within 5 min of addition of GroEL (the sample is not spun down). (D) Het-s fibrils obtained at room temperature 2 wk after the addition of GroEL, centrifuged, and the pellet was resuspended in water. The experimental and simulated first derivative EPR spectra are shown in the left and right columns, respectively. The simulated spectra were calculated with different correlation times and species populations as indicated (26). The derivative EPR spectra are normalized to the double integral.
Fig. 8.
Fig. 8.
Solid-state NMR of Het-s fibrils formed in the presence and absence of GroEL. Comparison of 1D [1H, 13C] CP-MAS (A) and [1H, 13C] INEPT-MAS (B) spectra of Het-s fibrils formed in the absence (blue) and presence (red) of GroEL. Insets shows the structure of a Het-s(218–289) fibril (PDB ID code 2RNM; ref. 8) with the rigid portions colored in dark gray (A) and the mobile tails and loops in orange (B). (C) Comparison of 2D [1H,13C] INEPT-MAS spectra of Het-s fibrils formed in the absence (blue) and presence (red) of GroEL. The 1D CP-based spectra (A) overlap perfectly showing that the rigid segments (dark gray) of the Het-s(218–289) fibrils have the same overall structure in presence and absence of GroEL, confirmed by the 2D [13C,13C] Dipolar Assisted Rotational Resonance (DARR) spectra shown in Fig. S6). There are large differences in peak intensities in the INEPT-based experiments (B and C) indicating differences in the mobile portions of the fibrils upon GroEL binding. Cross-peaks of Het-s fibrils with significant chemical shift differences in the presence and absence of GroEL, together with assignments in terms of residue/atom type probabilities (31), are indicated. One hundred micromolar monomeric Het-s(218–289) was fibrilized at room temperature under quiescent conditions in the absence and presence of 100 μM (in subunits) GroEL.
Fig. S6.
Fig. S6.
Comparison of 2D CP-MAS 13C/13C DARR correlation spectra of Het-s fibrils obtained in the absence (blue) and presence (red) of GroEL. During the 30-ms DARR mixing time, magnetization is transferred between adjacent 13C atoms by spin diffusion arising from 13C-13C dipolar couplings. Fibrilization of 100 μM Het-s(218–289) in the absence or presence of 100 μM (in subunits) GroEL was performed over a period of 3 wk at room temperature under quiescent conditions.
Fig. S7.
Fig. S7.
Global aliphatic 1H (A) and 13C transverse (B) relaxation rates (T2) of Het-s(218–289) fibrils formed in the absence (blue) and presence (red) of GroEL. 1H-T2 values are 24.7 ± 0.1 and 16.8 ± 0.1 ms for fibrils formed in the absence and presence of GroEL, respectively; the corresponding 13C-T2 values are 4.8 ± 0.1 and 3.9 ± 0.2 ms, respectively. Het-s fibrils were obtained by fibrilization of 100 μM Het-s monomer at room temperature for 3 wk under quiescent conditions in the absence and presence of 100 μM (in subunits) GroEL.

Similar articles

Cited by

  • Large Chaperone Complexes Through the Lens of Nuclear Magnetic Resonance Spectroscopy.
    Karamanos TK, Clore GM. Karamanos TK, et al. Annu Rev Biophys. 2022 May 9;51:223-246. doi: 10.1146/annurev-biophys-090921-120150. Epub 2022 Jan 19. Annu Rev Biophys. 2022. PMID: 35044800 Free PMC article. Review.
  • The expanding amyloid family: Structure, stability, function, and pathogenesis.
    Sawaya MR, Hughes MP, Rodriguez JA, Riek R, Eisenberg DS. Sawaya MR, et al. Cell. 2021 Sep 16;184(19):4857-4873. doi: 10.1016/j.cell.2021.08.013. Cell. 2021. PMID: 34534463 Free PMC article. Review.
  • Phage phiKZ-The First of Giants.
    Krylov V, Bourkaltseva M, Pleteneva E, Shaburova O, Krylov S, Karaulov A, Zhavoronok S, Svitich O, Zverev V. Krylov V, et al. Viruses. 2021 Jan 20;13(2):149. doi: 10.3390/v13020149. Viruses. 2021. PMID: 33498475 Free PMC article. Review.
  • What are the 100 most cited fungal genera?
    Bhunjun CS, Chen YJ, Phukhamsakda C, Boekhout T, Groenewald JZ, McKenzie EHC, Francisco EC, Frisvad JC, Groenewald M, Hurdeal VG, Luangsa-Ard J, Perrone G, Visagie CM, Bai FY, Błaszkowski J, Braun U, de Souza FA, de Queiroz MB, Dutta AK, Gonkhom D, Goto BT, Guarnaccia V, Hagen F, Houbraken J, Lachance MA, Li JJ, Luo KY, Magurno F, Mongkolsamrit S, Robert V, Roy N, Tibpromma S, Wanasinghe DN, Wang DQ, Wei DP, Zhao CL, Aiphuk W, Ajayi-Oyetunde O, Arantes TD, Araujo JC, Begerow D, Bakhshi M, Barbosa RN, Behrens FH, Bensch K, Bezerra JDP, Bilański P, Bradley CA, Bubner B, Burgess TI, Buyck B, Čadež N, Cai L, Calaça FJS, Campbell LJ, Chaverri P, Chen YY, Chethana KWT, Coetzee B, Costa MM, Chen Q, Custódio FA, Dai YC, Damm U, Santiago ALCMA, De Miccolis Angelini RM, Dijksterhuis J, Dissanayake AJ, Doilom M, Dong W, Álvarez-Duarte E, Fischer M, Gajanayake AJ, Gené J, Gomdola D, Gomes AAM, Hausner G, He MQ, Hou L, Iturrieta-González I, Jami F, Jankowiak R, Jayawardena RS, Kandemir H, Kiss L, Kobmoo N, Kowalski T, Landi L, Lin CG, Liu JK, Liu XB, Loizides M, Luangharn T, Maharachchikumbura SSN, Mkhwanazi GJM, Manawasinghe IS, Marin-Felix Y, McTaggart AR, Moreau PA, Morozova OV, Mostert L, … See abstract for full author list ➔ Bhunjun CS, et al. Stud Mycol. 2024 Jul;108:1-411. doi: 10.3114/sim.2024.108.01. Epub 2024 Jul 15. Stud Mycol. 2024. PMID: 39100921 Free PMC article.
  • Oligomerization of a molecular chaperone modulates its activity.
    Saio T, Kawagoe S, Ishimori K, Kalodimos CG. Saio T, et al. Elife. 2018 May 1;7:e35731. doi: 10.7554/eLife.35731. Elife. 2018. PMID: 29714686 Free PMC article.

References

    1. Hartl FU, Hayer-Hartl M. Molecular chaperones in the cytosol: From nascent chain to folded protein. Science. 2002;295:1852–1858. - PubMed
    1. Balch WE, Morimoto RI, Dillin A, Kelly JW. Adapting proteostasis for disease intervention. Science. 2008;319:916–919. - PubMed
    1. Hartl FU, Bracher A, Hayer-Hartl M. Molecular chaperones in protein folding and proteostasis. Nature. 2011;475:324–332. - PubMed
    1. Wyatt AR, Yerbury JJ, Dabbs RA, Wilson MR. Roles of extracellular chaperones in amyloidosis. J Mol Biol. 2012;421:499–516. - PubMed
    1. Chiti F, Dobson CM. Protein misfolding, functional amyloid, and human disease. Annu Rev Biochem. 2006;75:333–366. - PubMed

Publication types

MeSH terms