. 2017 Aug 22;114(34):9200-9205.
doi: 10.1073/pnas.1704754114. Epub 2017 Aug 7.

Aquaporins facilitate hydrogen peroxide entry into guard cells to mediate ABA- and pathogen-triggered stomatal closure

Affiliations

Aquaporins facilitate hydrogen peroxide entry into guard cells to mediate ABA- and pathogen-triggered stomatal closure

Olivier Rodrigues et al. Proc Natl Acad Sci U S A. .

Abstract

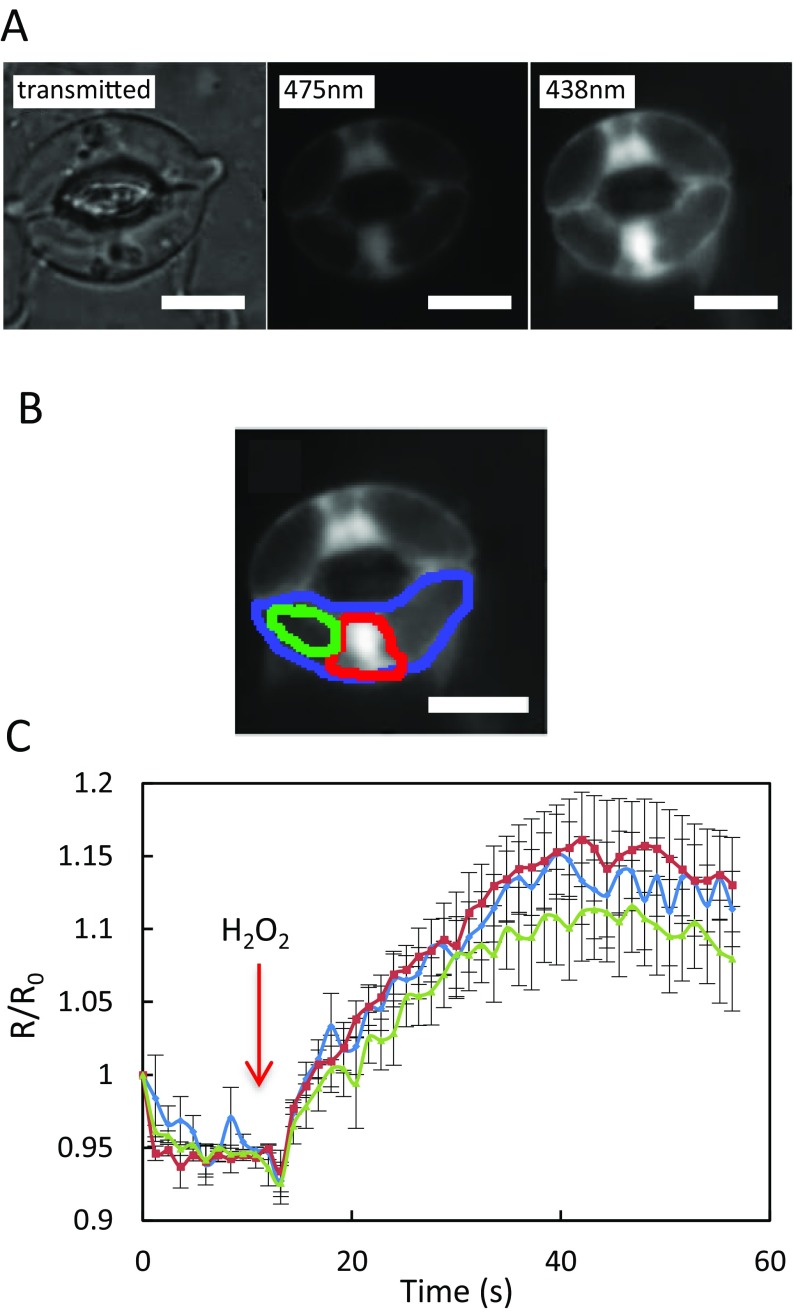
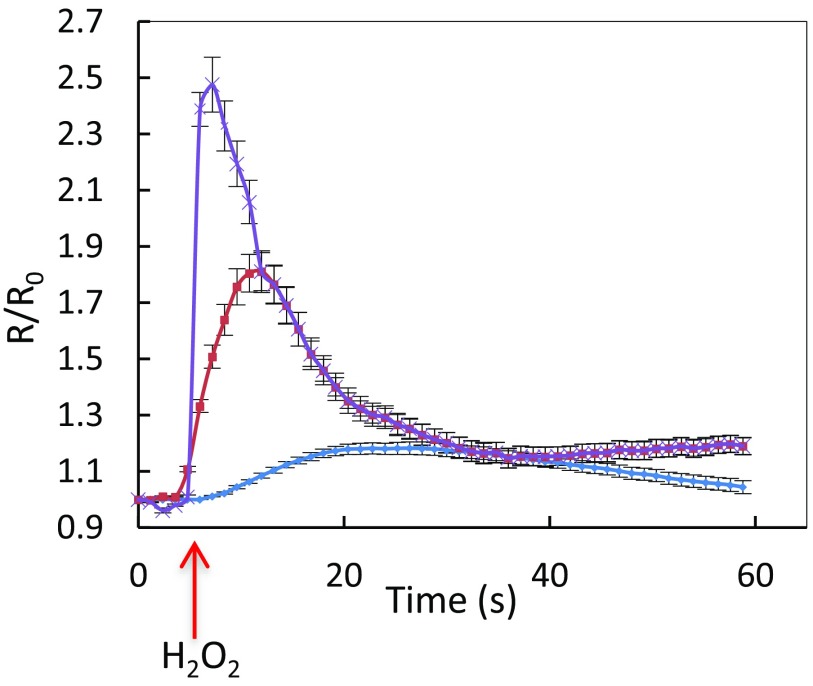
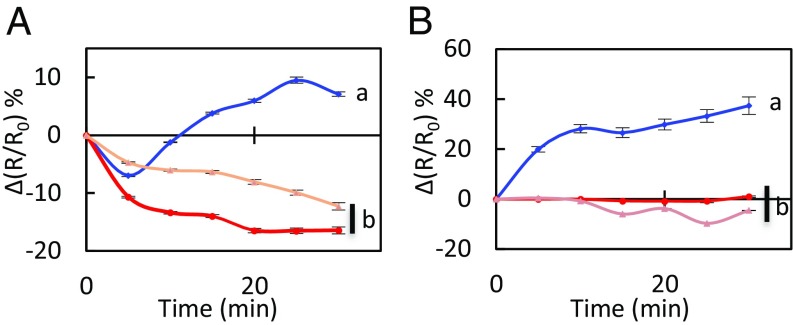
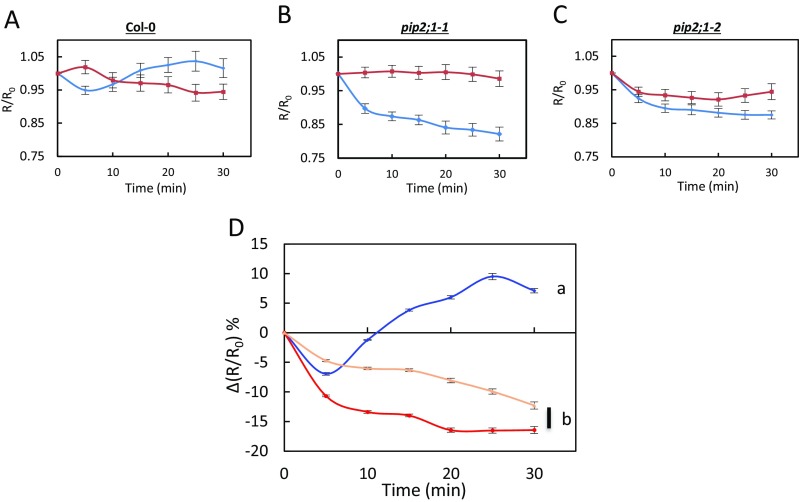
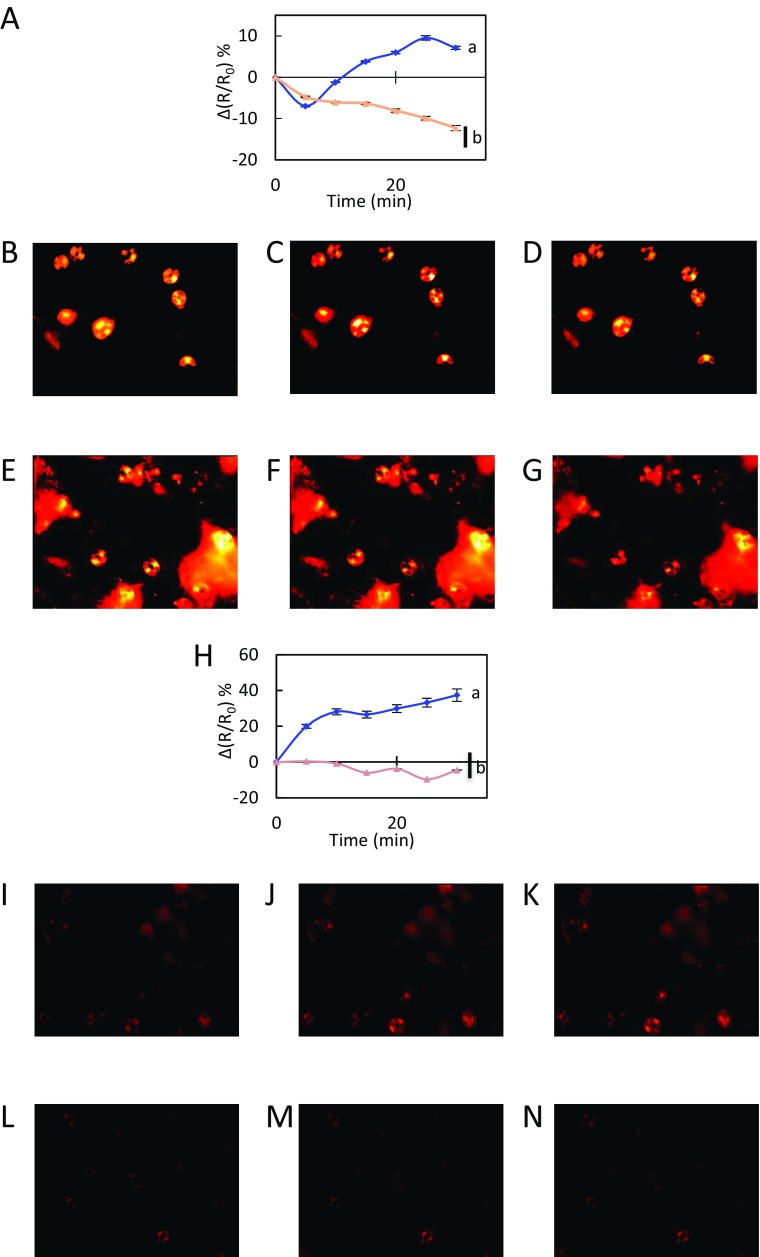
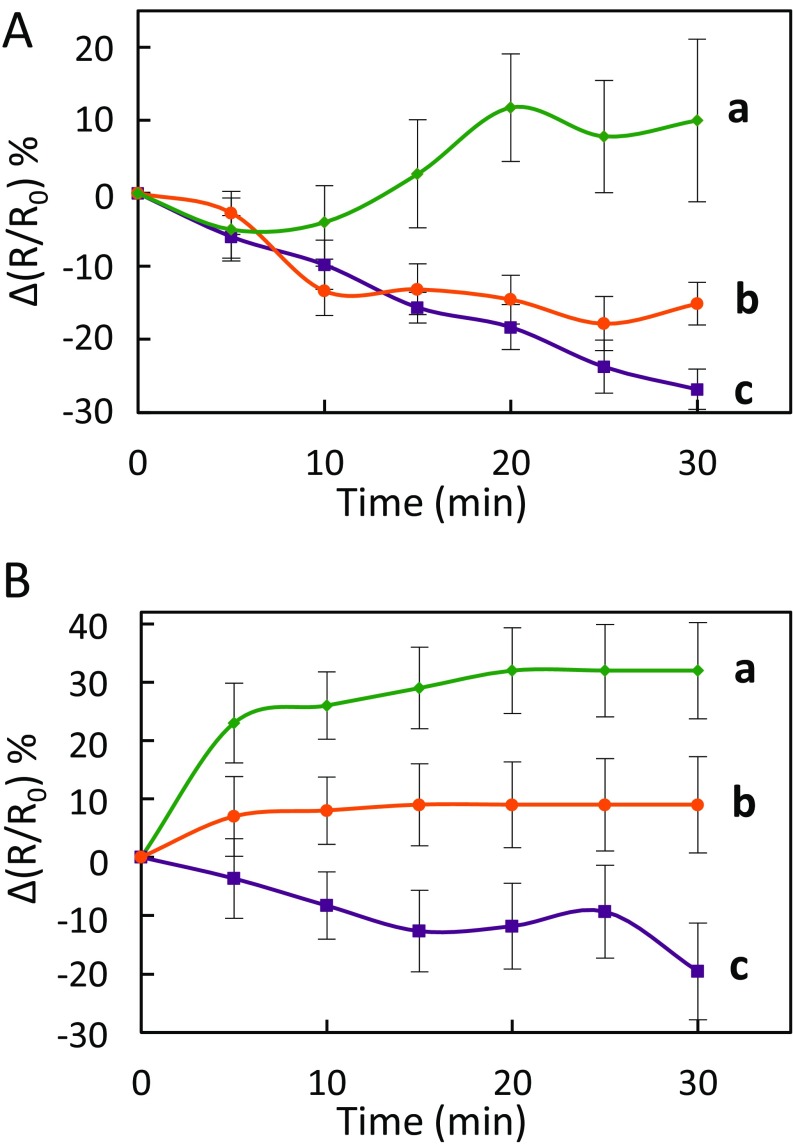
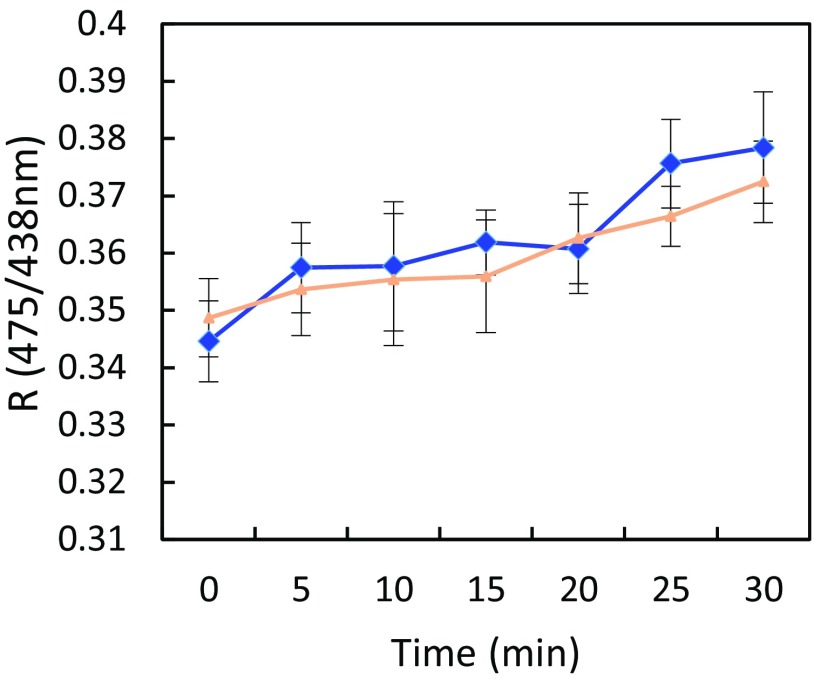
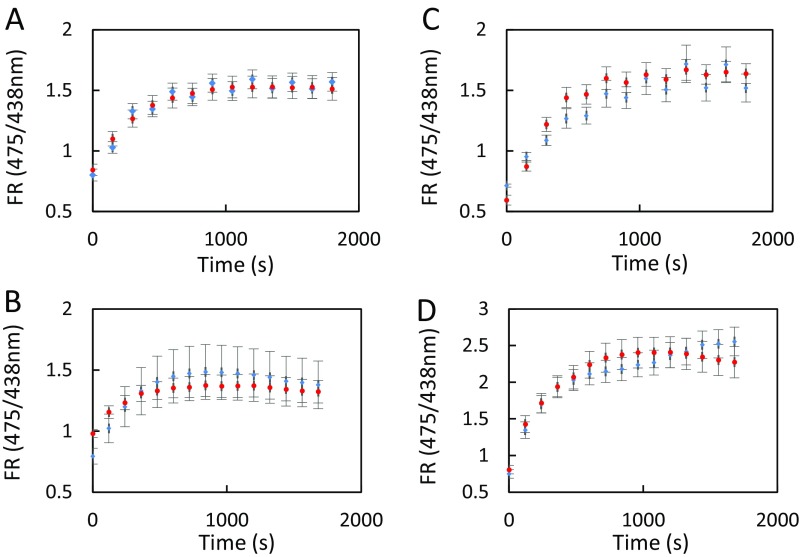
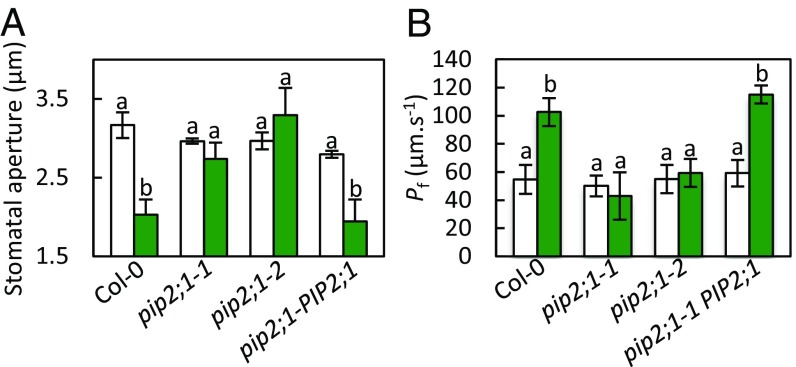
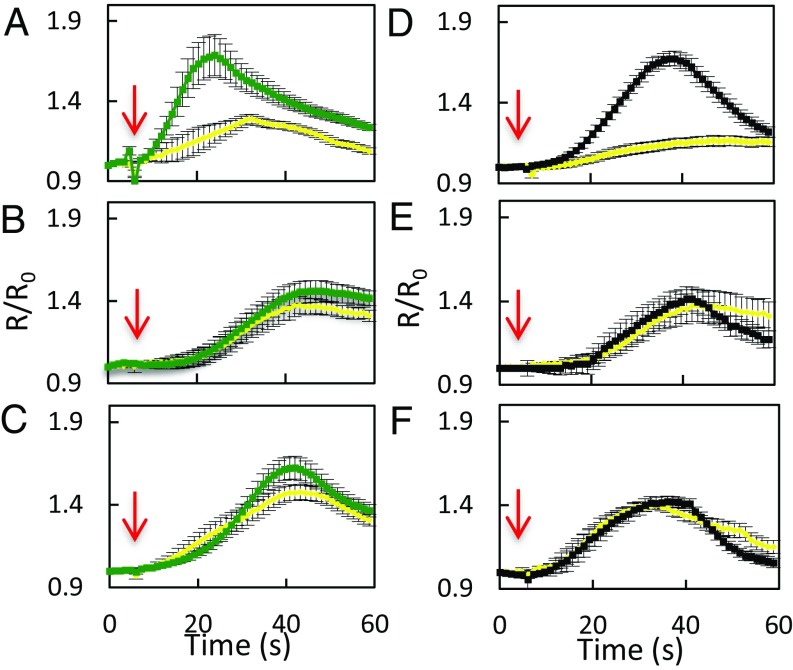
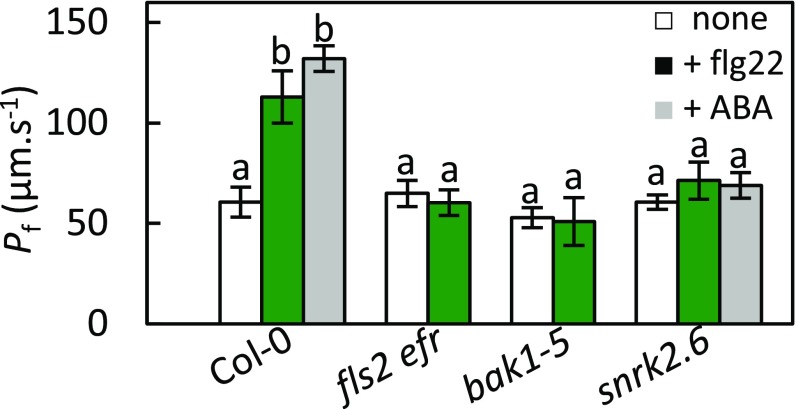
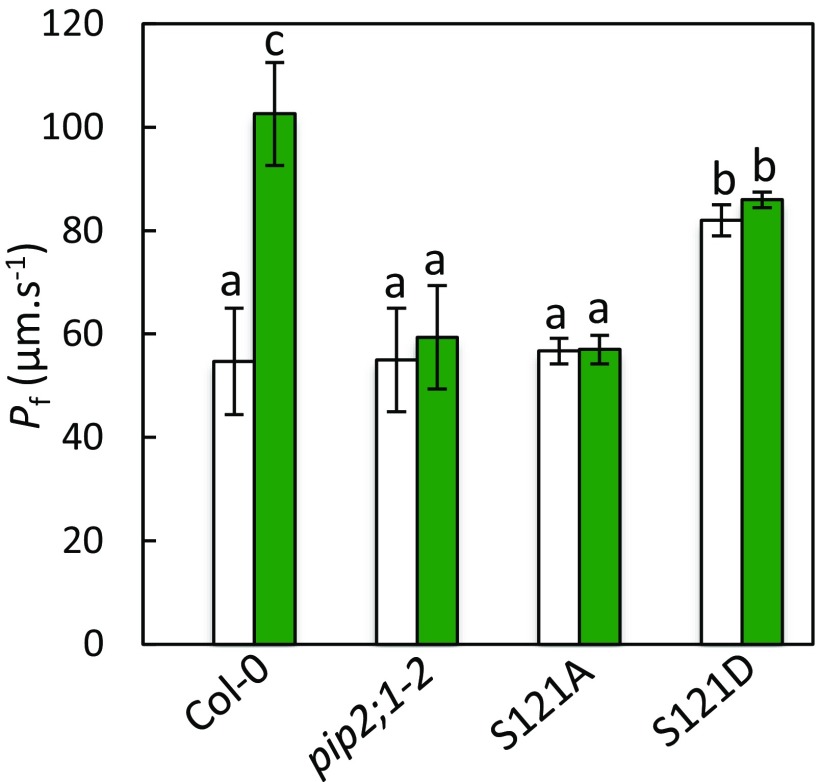
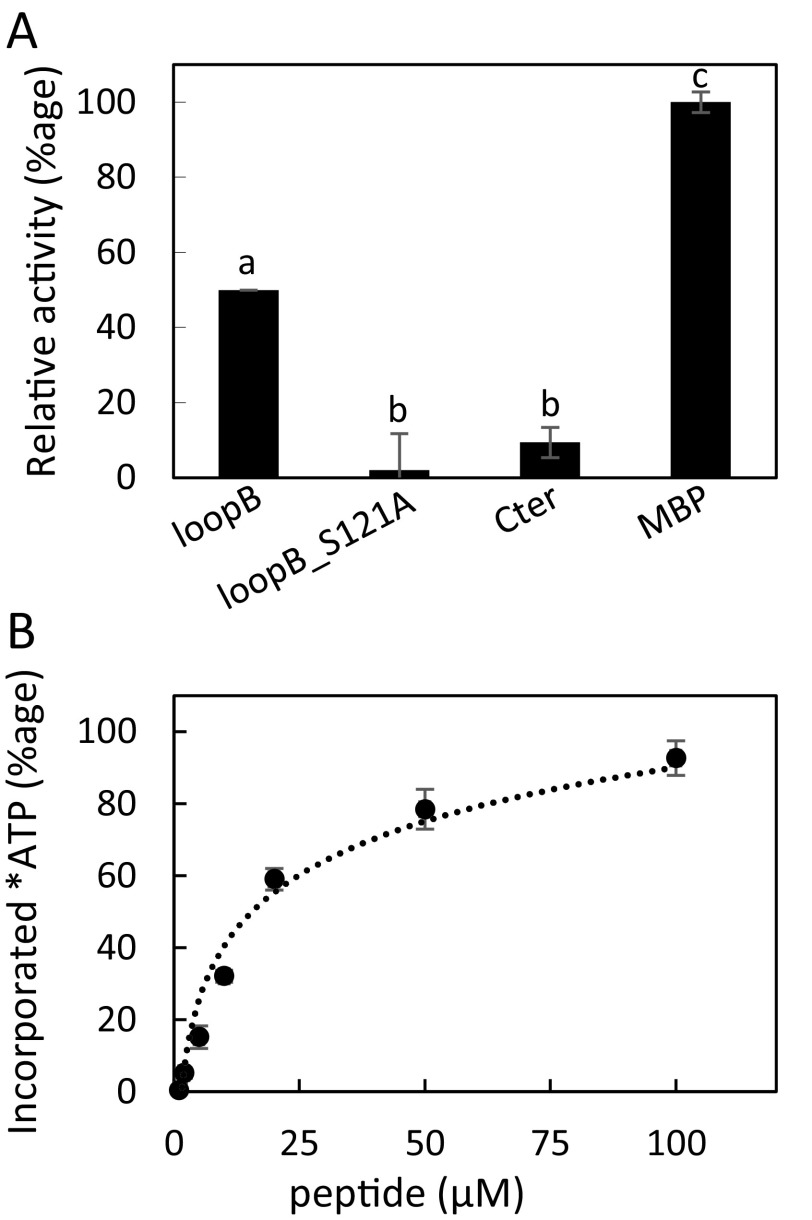
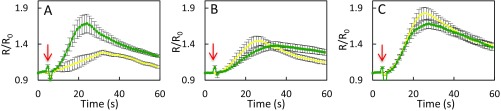
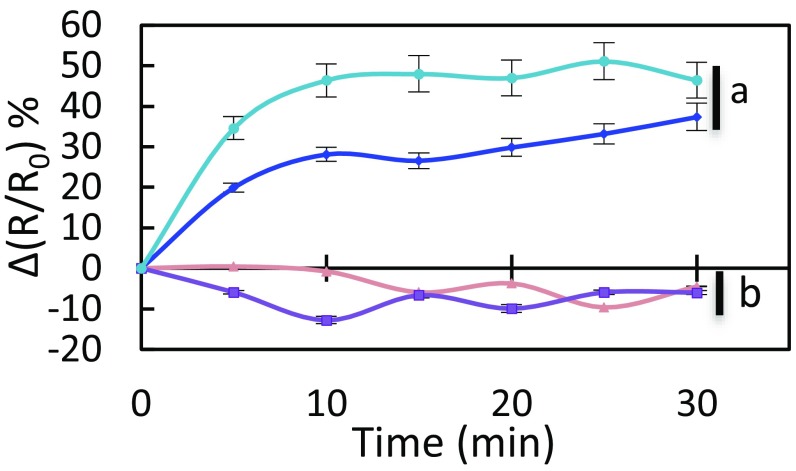
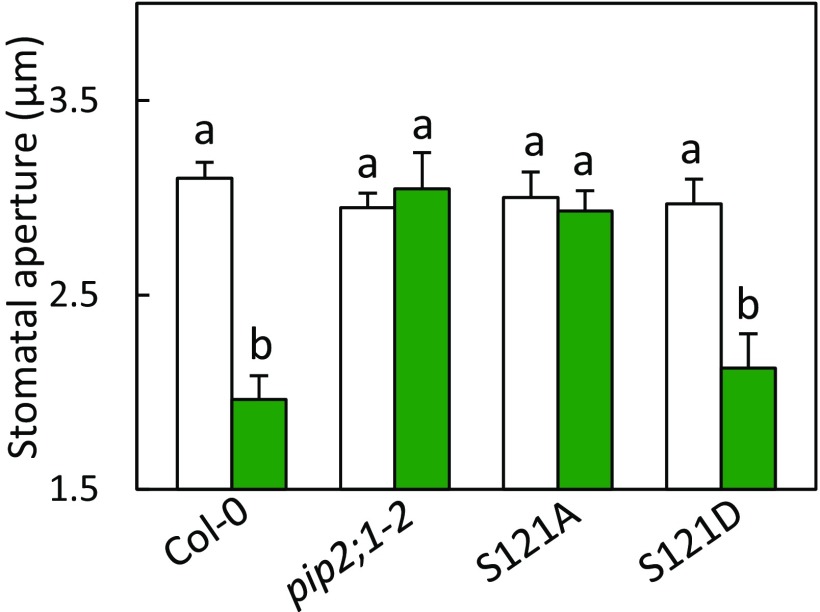
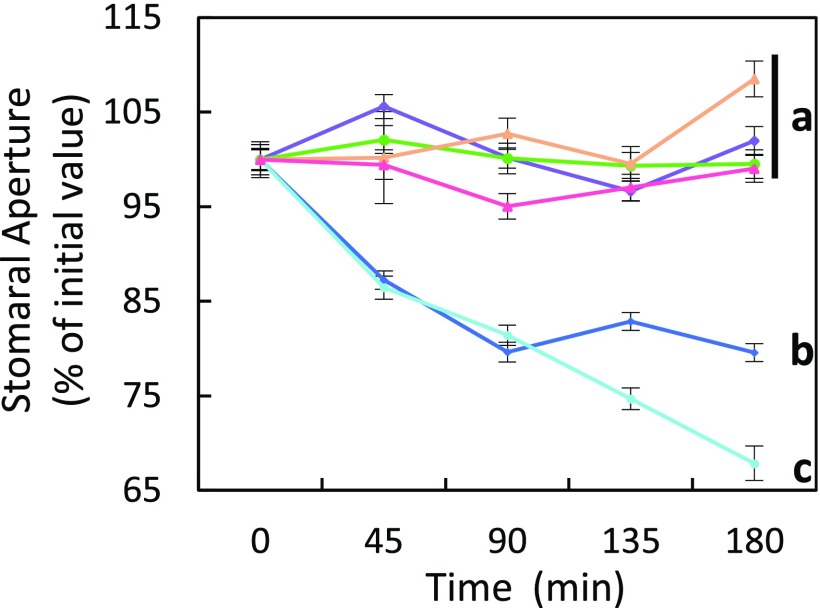
Stomatal movements are crucial for the control of plant water status and protection against pathogens. Assays on epidermal peels revealed that, similar to abscisic acid (ABA), pathogen-associated molecular pattern (PAMP) flg22 requires the AtPIP2;1 aquaporin to induce stomatal closure. Flg22 also induced an increase in osmotic water permeability (Pf) of guard cell protoplasts through activation of AtPIP2;1. The use of HyPer, a genetic probe for intracellular hydrogen peroxide (H2O2), revealed that both ABA and flg22 triggered an accumulation of H2O2 in wild-type but not pip2;1 guard cells. Pretreatment of guard cells with flg22 or ABA facilitated the influx of exogenous H2O2 Brassinosteroid insensitive 1-associated receptor kinase 1 (BAK1) and open stomata 1 (OST1)/Snf1-related protein kinase 2.6 (SnRK2.6) were both necessary to flg22-induced Pf and both phosphorylated AtPIP2;1 on Ser121 in vitro. Accumulation of H2O2 and stomatal closure as induced by flg22 was restored in pip2;1 guard cells by a phosphomimetic form (Ser121Asp) but not by a phosphodeficient form (Ser121Ala) of AtPIP2;1. We propose a mechanism whereby phosphorylation of AtPIP2;1 Ser121 by BAK1 and/or OST1 is triggered in response to flg22 to activate its water and H2O2 transport activities. This work establishes a signaling role of plasma membrane aquaporins in guard cells and potentially in other cellular context involving H2O2 signaling.

Keywords: aquaporin; guard cell signaling; hydrogen peroxide; pathogen; stomatal movement.


Conflict of interest statement

The authors declare no conflict of interest.

Figures

Fig. S1.
Fig. S1.
Expression and oxidation of HyPer in distinct A. thaliana guard cell zones in response to exogenous H2O2. (A) Leaf epidermal peels were observed by microscopy under visible or fluorescent light. Excitation of the oxidized and reduced states of HyPer was performed at 475 nm and 438 nm, respectively, and emission was detected at 530 nm in both cases. (B) Areas selected for kinetic analysis of relative changes in fluorescence ratio (R/R0): whole cell (blue diamonds), nucleus and its periphery (red squares), and a region occupied by large vacuoles (green triangles). (C) Time course of R/R0 variations for the three zones described in A. Fifty micromolar H2O2 was added to the epidermal peel at t = 10 s (arrow). Error bars represent SEs from average measurements on 8–12 guard cells. (Scale bars: 5 µm.)
Fig. S2.
Fig. S2.
Kinetics of HyPer oxidation in Col-0 guard cells in response to exogenous H2O2. Epidermal peels were exposed from t = 5 s to three exogenous H2O2 concentrations: 50 µM (blue diamonds), 100 µM (red squares), and 200 µM (purple cross), and R/R0 was measured over time. The error bars represent SEs from average measurements on 8–12 guard cells.
Fig. 1.
Fig. 1.
Kinetic variations of HyPer fluorescence induced by ABA (A) or flg22 (B) in guard cells. Col-0 (purple diamonds), pip2;1-1 (red squares) and pip2;1-2 (tan triangles) epidermal peels were exposed to light during 3 h before treatment (t = 0) with 50 µM ABA (A), 1 µM flg22 (B) or control buffers [0.1% ethanol (A) or water (B)]. The R/R0 measured in control guard cells was subtracted from R/R0 in guard cells exposed to ABA or flg22, yielding ∆(R/R0). Error bars represent SEs. Data from three independent plant cultures, each with 30 guard cells by genotype. The letters indicate statistically different values (ANOVA, Newman–Keuls: P < 0.05).
Fig. S3.
Fig. S3.
Kinetic variations of HyPer signal induced by exogenous ABA in Col-0 and pip2;1 guard cells. (A–C) Epidermal peels from Col-0 (A), pip2;1-1 (B), and pip2;1-2 (C) plants were exposed to light during 3 h before exposure at t = 0 to ABA (50 µM) (blue diamonds) or a control treatment (0.1% ethanol) (red squares). R/R0 was measured in guard cells at the indicated time. (D) The graph shows a plot, at each time point and for each genotype (Col-0: blue diamonds; pip2;1-1: red circles; pip2;1-2: tan triangles) of the difference in R/R0 (Fig. 1A) between ABA-treated and control guard cells [∆(R/R0)]. Error bars represent SEs.
Fig. S4.
Fig. S4.
Kinetic variations of HyPer fluorescence induced by flg22 in guard cells. Col-0 (blue diamonds) and pip2;1-2 (tan triangles) epidermal peels were exposed to light during 3 h before treatment (t = 0) with 50 µM ABA (A–G) or 1 µM flg22 (H–N) as described in Fig. 1. Representative images of changes of HyPer fluorescence ratio (R) are shown at t = 0 (B, E, I, and L), t = 20 min (C, F, J, and M), and t = 30 min (D, G, K, and N). As cumulative data shown in Fig. 1 and in A and H is the average of three independent experiments with more than 30 guard cells analyzed, the images shown here do not reflect perfectly the average ratio changes measured in this study. Movies of the whole kinetics are also available (Movies S1–S4).
Fig. S5.
Fig. S5.
Effects of catalase on the changes in HyPer fluorescence [∆(R/R0)] induced by ABA (A) or flg22 (B) in Col-0 guard cells. Epidermal peels were exposed to light for 3 h before exposure (at t = 0) to 50 µM ABA (A) or 1 µM flg22 (B), in the presence (orange circles) or in the absence (green diamonds) of 200 U catalase. A control treatment at t = 0 with catalase alone (purple squares) was also performed. Time-dependent variations in ∆(R/R0) were calculated by reference to untreated epidermis as exemplified in Fig. S3. Error bars represent SEs. Data are from three independent plant cultures, with at least 30 guard cells per genotype and experiment. The letters indicate statistically different values (ANOVA, NewmanKeuls: P < 0.05).
Fig. S6.
Fig. S6.
Kinetic variations of HyPer signal induced by exogenous flg22 in mesophyll cell protoplasts of Col-0 and pip2;1-2. Protoplasts from Col-0 (blue diamonds) and pip2;1-2 (tan triangles) plants were exposed to light during 2 h before exposure at t = 0 to flg22 (1 µM). Ratiometric fluorescence (R) of HyPer with excitations at 475 and 438 nm was measured at the indicated time. Error bars represent SEs. Data are from at least 50 mesophyll protoplasts per genotype and experiment.
Fig. S7.
Fig. S7.
Kinetic variations of BCECF signal induced by exogenous ABA or flg22 and their respective control treatments in Col-0 and pip2;1-1 guard cells. Epidermal peels from Col-0 (blue diamonds) or pip2;1-1 (red circles) plants were exposed to light during 3 h before exposure at t = 0 to ABA (50 µM) (A) or its control treatment (0.1% ethanol) (B) or to flg22 (1 µM) (C) or its control treatment (H2O) (D). An FR at 530 nm was calculated as FR = (Ei475−Eb475)/(Ei438−Eb438) after excitation of the unprotonated and protonated states of BCECF at 475 nm and 438 nm, respectively, and measured in guard cells at the indicated time. Error bars represent SEs. Data from three independent plant cultures, each with >150 guard cells by genotype.
Fig. 2.
Fig. 2.
Stomatal movement and water transport responses of Col-0, pip2;1-1, pip2;1-2, pip2;1-PIP2;1 to flg22. (A) Epidermal peels from the indicated genotypes were placed in a bathing solution for 3 h under light and further incubated in the absence (white bars) or in the presence of 1 µM flg22 (green bars). Stomatal aperture was measured after 2 h. Data from three independent plant cultures, each with 60 stomata per genotype. Error bars represent SEs. The letters indicate statistically different values (ANOVA, Newman–Keuls: P < 0.05). (B) Guard cell protoplasts were isolated from the indicated genotypes and incubated under light in the absence (white bars) or presence (green bars) of 1 μM flg22. Their Pf was measured as described in Materials and Methods. Data from three independent experiments, with a total of n = 12–17 protoplasts per condition. Same conventions as in A.
Fig. 3.
Fig. 3.
Influx of exogenously supplied H2O2in guard cells of Col-0, pip2;1-1, and pip2;1-2 plants. Epidermal peels from Col-0 (A and D), pip2;1-1 (B and E) or pip2;1-2 (C and F) plants were placed under light for 3 h and subsequently treated for 6 min by flg22 (1 µM) (green) or water (yellow) (AC) or by ABA (10 µM) (black) or ethanol (0.02%) (yellow) (DF) before application of exogenous H2O2. Kinetic changes in HyPer fluorescence (R/R0) were recorded before and after the application of 100 µM H2O2 (red arrow at t = 5 s). Error bars represent the SEs from measurements cumulating three independent plant cultures, with a total between 30 and 40 guard cells per genotype.
Fig. 4.
Fig. 4.
Water transport responses of Col-0, fls2 efr, bak1-5, and snrk2;6 to light, flg22, and ABA. Guard cell protoplasts were isolated from the indicated genotypes and incubated under light in the absence (white bars) or presence of 1 μM flg22 (green bars) or 10 µM ABA (gray bars). Their Pf was measured as described in Materials and Methods. Data from three independent experiments, with a total of n = 7–10 protoplasts per condition. Error bars represent SEs. The letters indicate statistically different values (ANOVA, Newman–Keuls: P < 0.05).
Fig. S8.
Fig. S8.
Effect of flg22 on Pf of guard cell protoplasts from Col-0, pip2;1-2, S121A, and S121D plants. Guard cell protoplasts were isolated from the indicated genotypes and incubated under light in the absence (white bars) or in the presence (green bars) of 1 μM flg22. Their Pf was measured as described in Materials and Methods. Data from three independent plant cultures, with a total of n = 12–17 protoplasts per condition. The letters indicate statistically different values (ANOVA, NewmanKeuls: P < 0.05).
Fig. S9.
Fig. S9.
In vitro phosphorylation of AtPIP2;1 peptides by BAK1. (A) Phosphorylation by purified BAK1 of native or mutated peptides from the loop B and C-terminal region of AtPIP2;1. Incorporated ATP (±SE) from n = 4 independent experiments was normalized to the signal observed with the reference myelin basic protein (MBP). (B) The loop B AtPIP2;1 peptide was incubated at the indicated concentrations, in the presence of labeled ATP and purified BAK1. The mean incorporated ATP (±SE) was determined from four independent experiments, each with 2–3 technical replicates. Calculated affinity (Km) is = 18.2 ± 5 μM.
Fig. S10.
Fig. S10.
Influx of exogenously supplied H2O2 in guard cells of Col-0, S121A, and S121D plants. Epidermal peels from Col-0 (A), S121A (B), or S121D (C) plants were placed under light during 3 h and subsequently treated by flg22 (1 µM) (green squares) or water (yellow squares) for 6 min. Kinetic changes in HyPer fluorescence (R/R0) were recorded before and after the application of 100 µM H2O2 (red arrow at t = 5 s). Error bars represent the SEs from measurements cumulated from three independent plant cultures, with a total between 30 and 40 guard cells per genotype.
Fig. 5.
Fig. 5.
Kinetic variations of HyPer fluorescence induced by flg22 in guard cells of Col-0 (blue diamonds), pip2;1-2 (tan triangles), S121A (purple squares), and S121D (sky blue circles) plants. Same procedures and conventions as in Fig. 1B. Data from three independent plant cultures, each with at least 30 guard cells by genotype.
Fig. S11.
Fig. S11.
Stomatal movement response of Col-0, pip2;1-2, S121A, and S121D plants to flg22. Epidermal peels from the indicated genotypes were incubated in a bathing solution under light for 3 h, before application of 1 µM flg22 (green bars) or a mock treatment (white bars). Stomatal aperture was measured after 2 h. Data from three independent plant cultures, with a total of at least 60 stomata per condition. Error bars represent SEs. Letters indicate statistically different values (ANOVA, Newman–Keuls: P < 0.05).
Fig. S12.
Fig. S12.
Effects of catalase on the stomatal response of Col-0, pip2;1-2, and S121D plants to flg22. Epidermal peels from the indicated genotypes were incubated in a bathing solution under light for 3 h, before application of 1 µM flg22 in the presence (Col-0: purple diamonds; pip2;1-2: pink triangles; S121D: green circles) or absence (Col-0: blue diamonds; pip2;1-2: tan triangles; S121D: sky blue circles) of 200 U of catalase. Stomatal aperture was measured every 30 min for 3 h. Data from three independent plant cultures, with a total of at least 80 stomata per condition. Error bars represent SEs. Letters indicate statistically different values (ANOVA, Newman–Keuls: P < 0.05).

References

    1. Hetherington AM, Woodward FI. The role of stomata in sensing and driving environmental change. Nature. 2003;424:901–908. - PubMed
    1. Roelfsema MR, Hedrich R. In the light of stomatal opening: New insights into ‘the Watergate’. New Phytol. 2005;167:665–691. - PubMed
    1. Kim TH, Böhmer M, Hu H, Nishimura N, Schroeder JI. Guard cell signal transduction network: Advances in understanding abscisic acid, CO2, and Ca2+ signaling. Annu Rev Plant Biol. 2010;61:561–591. - PMC - PubMed
    1. Park SY, et al. Abscisic acid inhibits type 2C protein phosphatases via the PYR/PYL family of START proteins. Science. 2009;324:1068–1071. - PMC - PubMed
    1. Joshi-Saha A, Valon C, Leung J. A brand new START: Abscisic acid perception and transduction in the guard cell. Sci Signal. 2011;4:re4. - PubMed

Publication types

MeSH terms