. 2017 Sep 5;114(36):E7554-E7563.
doi: 10.1073/pnas.1703094114. Epub 2017 Aug 7.

Molecularly targeted drug combinations demonstrate selective effectiveness for myeloid- and lymphoid-derived hematologic malignancies

Affiliations

Molecularly targeted drug combinations demonstrate selective effectiveness for myeloid- and lymphoid-derived hematologic malignancies

Stephen E Kurtz et al. Proc Natl Acad Sci U S A. .

Abstract

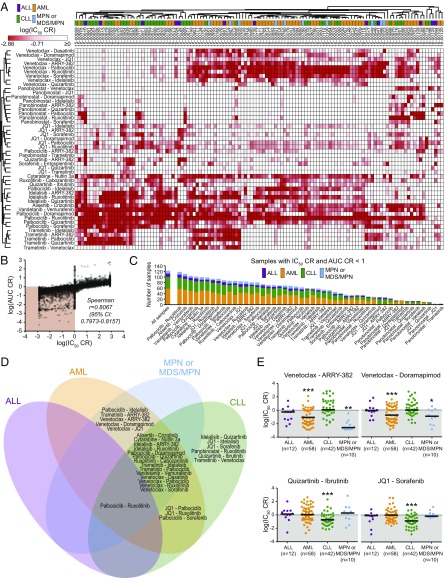
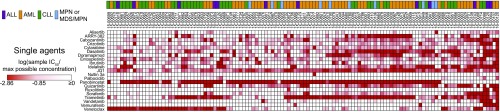
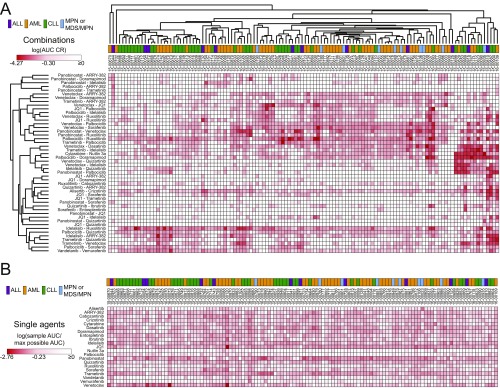
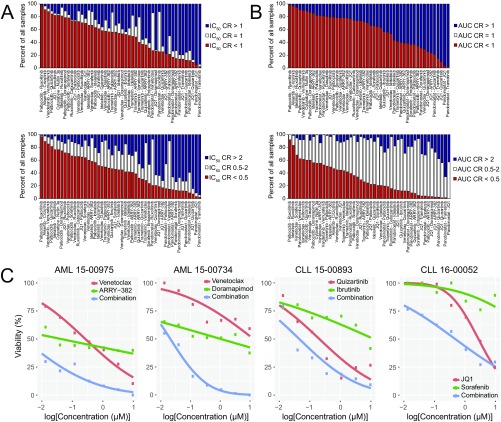
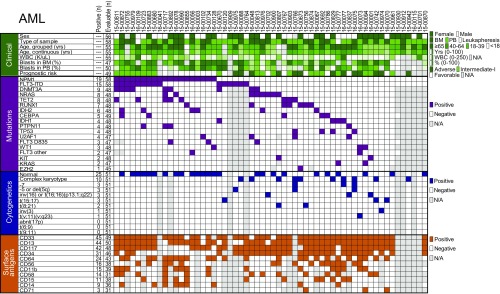
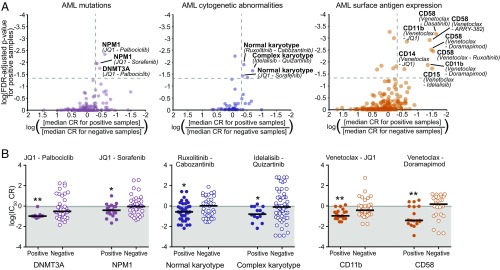
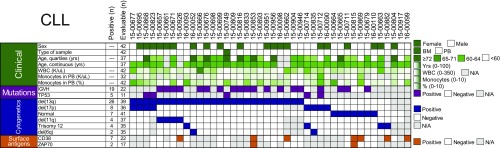
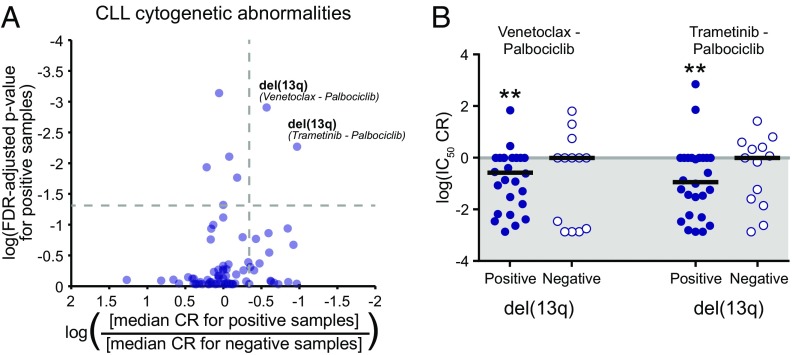
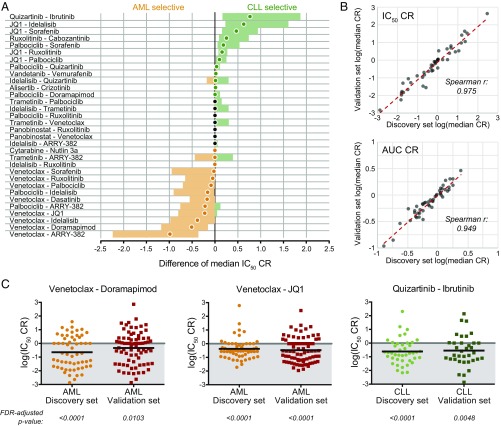
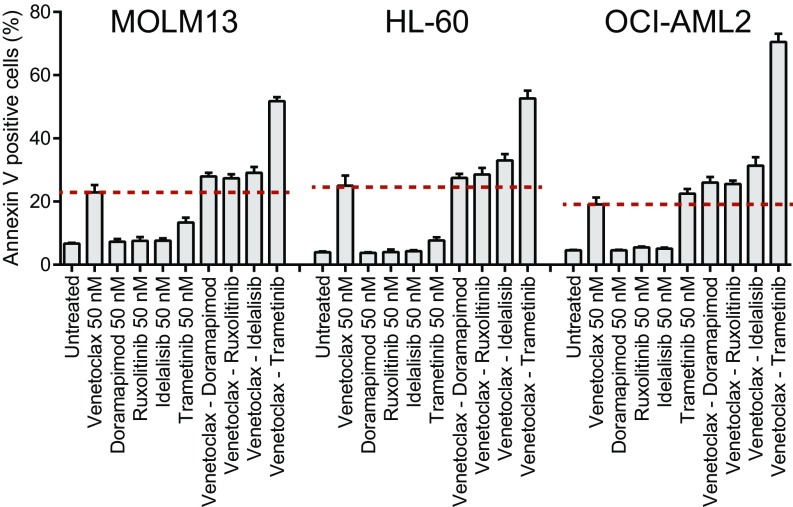
Translating the genetic and epigenetic heterogeneity underlying human cancers into therapeutic strategies is an ongoing challenge. Large-scale sequencing efforts have uncovered a spectrum of mutations in many hematologic malignancies, including acute myeloid leukemia (AML), suggesting that combinations of agents will be required to treat these diseases effectively. Combinatorial approaches will also be critical for combating the emergence of genetically heterogeneous subclones, rescue signals in the microenvironment, and tumor-intrinsic feedback pathways that all contribute to disease relapse. To identify novel and effective drug combinations, we performed ex vivo sensitivity profiling of 122 primary patient samples from a variety of hematologic malignancies against a panel of 48 drug combinations. The combinations were designed as drug pairs that target nonoverlapping biological pathways and comprise drugs from different classes, preferably with Food and Drug Administration approval. A combination ratio (CR) was derived for each drug pair, and CRs were evaluated with respect to diagnostic categories as well as against genetic, cytogenetic, and cellular phenotypes of specimens from the two largest disease categories: AML and chronic lymphocytic leukemia (CLL). Nearly all tested combinations involving a BCL2 inhibitor showed additional benefit in patients with myeloid malignancies, whereas select combinations involving PI3K, CSF1R, or bromodomain inhibitors showed preferential benefit in lymphoid malignancies. Expanded analyses of patients with AML and CLL revealed specific patterns of ex vivo drug combination efficacy that were associated with select genetic, cytogenetic, and phenotypic disease subsets, warranting further evaluation. These findings highlight the heuristic value of an integrated functional genomic approach to the identification of novel treatment strategies for hematologic malignancies.

Keywords: drug combinations; ex vivo assay; hematologic malignancies; targeted therapies.


Conflict of interest statement

Conflict of interest statement: D.A.P. serves on the advisory boards for Pharmacyclics and Gilead. J.W.T. receives research support from Agios, Array Biopharma, Aptose, AstraZeneca, Constellation, Genentech, Gilead, Incyte, Janssen R&D, Seattle Genetics, Syros, and Takeda and is a consultant for Leap Oncology. B.J.D. serves on the advisory boards for Gilead and Roche TCRC. B.J.D. is principal investigator or coinvestigator on Novartis and BMS clinical trials. His institution, Oregon Health & Science University, has contracts with these companies to pay for patient costs, nurse and data manager salaries, and institutional overhead. He does not derive salary, nor does his laboratory receive funds from these contracts. M.W.D. serves on the advisory boards and/or as a consultant for Novartis, Incyte, and BMS and receives research funding from BMS and Gilead. The authors certify that all compounds and combinations tested in this study were chosen without input from any of our industry partners.

Figures

Fig. 1.
Fig. 1.
Differential patterns of selective efficacy of small-molecule combinations relative to single agents. (A) Unsupervised hierarchical clustering of IC50 CR values for 122 patients with leukemia across 48 tested combinations. IC50 CR values were log-transformed and row- and column-clustered using Pearson correlation pairwise average linkage method. Darker red color (lower CR values) indicates drug combinations exhibiting higher efficacy than either single agent alone. Diagnostic category annotation of each sample is also shown. (B) Correlation of IC50 CR and AUC CR effect measure values. Shaded region indicates sample/drug pairs for which the combination was more effective than either single agent (CR < 1) by both effect measures. (C) Distribution of effective drug combinations based on frequency and diagnostic category. Bar labeled “all samples” indicates diagnosis group breakdown for all 122 surveyed patient samples for comparison. (D) Overlap of significantly effective inhibitor combinations among four general diagnosis subgroups. Combinations for which median IC50 CR and AUC CR were significantly <1 within each diagnostic subgroup are shown; combinations listed in overlapping regions were significantly effective in each subgroup. (E) Select examples of combinations by diagnostic subgroup. Scatter plots of log-transformed IC50 CR values for select combinations. Black horizontal bars represent median CR. (*Median CR significantly <1 in that subgroup.)
Fig. S1.
Fig. S1.
Single-agent IC50 heat map for all 122 evaluated leukemia patient samples. IC50 values for 122 patients with leukemia across each of the 21 individually tested small-molecule inhibitors were normalized to the maximum tested concentration (1 µM for dasatinib, 10 µM for all other inhibitors) and log-transformed. Patient samples are represented in columns in the identical clustered order as identified from the corresponding combination data in Fig. 1A. Darker red color indicates increased sensitivity, and the diagnostic category annotation of each sample is shown.
Fig. S2.
Fig. S2.
Clustering of AUC-based effect measures of combination and single-agent efficacy for all 122 evaluated leukemia patient samples. (A) Unsupervised hierarchical clustering of AUC CR values for 122 patients with leukemia across 48 tested combinations. AUC CR values (defined as the ratio of the combination AUC to that of the smallest AUC of either drug alone) were log-transformed and row- and column-clustered by using a Pearson correlation pairwise average linkage method. Darker red color indicates lower CR values, and diagnostic category annotation of each sample is shown. (B) Single-agent AUC heat map for all 122 evaluated leukemia patient samples. AUC values for all samples across each of the 21 individually tested small-molecule inhibitors were normalized to the maximum possible AUC value of 286.27 and log-transformed. Patient samples are represented in columns in the identical clustered order as identified from the corresponding combination data in A. Darker red color indicates increased sensitivity, and the diagnostic category annotation of each sample is shown.
Fig. S3.
Fig. S3.
Distribution of IC50 and AUC CRs across all tested patient samples. For each combination tested, frequency of samples with CR values are shown for IC50 (A) and AUC (B) effect measures. Two different sets of cut points were examined: CR > 1/CR = 1/CR < 1 (Upper) or CR > 2/CR = 0.5–2/CR < 0.5 (Lower). Combinations are sorted according to frequency of samples with CR values <1 or <0.5, respectively. (C) Representative dose–response curves for patients with AML or CLL exhibiting CR values <1 for select combinations shown in Fig. 1E. Probit-derived curves for each single agent and the combination are shown.
Fig. 2.
Fig. 2.
Clinical and genetic features of patients with AML surveyed. Panels of the indicated disease-specific clinical, prognostic, mutation, cytogenetic, and surface antigen features were compared among all 58 patients with AML in the study. The number of patients evaluable for each feature is given, along with the number of positive samples for that feature (when relevant for categorical variables). Gray boxes indicate unavailable information. Each patient is shown in a unique column, and samples are sorted from left to right according to frequency of genetic mutations.
Fig. 3.
Fig. 3.
Associations of selective inhibitor combination benefit with mutation, cytogenetic, and surface antigen expression features in AML. (A) Scatter plots of combination/feature pairing test significance vs. difference in median CR between subgroups. Summaries for mutation (Left), cytogenetic (Middle), and surface antigens (Right). All plotted points correspond to combination/feature pairings in which (i) median IC50 and AUC CR of the negative samples were not significantly <1 and (ii) positive and negative subgroups contained at least 15% of total evaluable samples each. Points above the horizontal dashed gray line demonstrated median IC50 CR and AUC CR values for positive subgroup that were significantly <1 (i.e., FDR-adjusted P < 0.05). Points to the right of the vertical dashed gray line represent those in which the median IC50 CR value of the positive subgroup was at least twofold lower than that of the negative subgroup. (B) Scatter plots of log-transformed IC50 CR values for select combinations by AML mutation (Left), cytogenetic (Middle), and surface antigen expression subgroups (Right). Black horizontal bars represent median CR value. (*Median CR significantly <1 in that subgroup.)
Fig. 4.
Fig. 4.
Clinical and genetic features of patients with CLL surveyed. Panels of the indicated disease-specific clinical, mutation, cytogenetic, and surface antigen features were compared among all 42 patients with CLL in the study. The number of patients evaluable for each feature is given, along with the number of positive samples for a given feature (when relevant for categorical variables). Gray boxes indicate unavailable information. Each patient is shown in a unique column, and samples are sorted from left to right according to frequency of cytogenetic abnormalities.
Fig. 5.
Fig. 5.
Sensitivity of CLL patient samples harboring del(13q)to combinations with the CDK4/6 inhibitor palbociclib. (A) Scatter plot of combination-feature pairing test significance vs. difference in median CR between subgroups. All plotted points correspond to combination/feature pairings in which (i) the median IC50 and AUC CR of the negative samples were not significantly <1 and (ii) the positive and negative subgroups contained at least 15% of the total evaluable samples each. Points above the horizontal dashed gray line demonstrate median IC50 CR and AUC CR values for the positive subgroup that were significantly <1 (i.e., FDR-adjusted P < 0.05). Points to the right of the vertical dashed gray line represent those for which the median IC50 CR value of the positive subgroup was at least twofold lower than that of the negative subgroup. (B) Scatter plot of log-transformed IC50 CR values for select combinations effective in del(13q)-positive CLL samples. Black horizontal bars represent the median CR value. (*Median CR is significantly <1 in that subgroup.)
Fig. 6.
Fig. 6.
Validation of combination selectivity between AML and CLL. (A) The difference of median IC50 CR values (AML – CLL) was computed for each of 48 indicated combinations by using the Hodges-Lehmann method. The median difference is represented by a closed circle, and the 95% CI is shown as the colored bar. AML-selective and CLL-selective combinations are colored orange or green, respectively. (B) Spearman correlation of log-transformed median IC50 CR and AUC CR values between the discovery sample cohort (N = 122) and independent validation cohort (N = 151). (C) Validation of select effective combinations within AML or CLL diagnostic subgroups. Scatter plots of log-transformed IC50 CR values for the indicated combinations. Black horizontal bars represent median CR; FDR-adjusted P values (Wilcoxon signed-rank test of median) are shown.
Fig. S4.
Fig. S4.
Apoptosis induction for venetoclax combinations in AML cell lines. Three human AML cell lines (MOLM13, HL-60, and OCI-AML2) were cultured in the presence of venetoclax alone or in combination with doramapimod, ruxolitinib, idelalisib, or trametinib. All drug concentrations used were 50 nM. After 48 h, the percentage of cells positive for annexin V staining were measured by Guava Nexin assay (Millipore). Bars indicate the mean of three replicates ± SD.

References

    1. Dienstmann R, Jang IS, Bot B, Friend S, Guinney J. Database of genomic biomarkers for cancer drugs and clinical targetability in solid tumors. Cancer Discov. 2015;5:118–123. - PMC - PubMed
    1. Friedman AA, Letai A, Fisher DE, Flaherty KT. Precision medicine for cancer with next-generation functional diagnostics. Nat Rev Cancer. 2015;15:747–756. - PMC - PubMed
    1. Ley TJ, et al. Cancer Genome Atlas Research Network Genomic and epigenomic landscapes of adult de novo acute myeloid leukemia. N Engl J Med. 2013;368:2059–2074. - PMC - PubMed
    1. Döhner H, Weisdorf DJ, Bloomfield CD. Acute myeloid leukemia. N Engl J Med. 2015;373:1136–1152. - PubMed
    1. Chao MP, Seita J, Weissman IL. Establishment of a normal hematopoietic and leukemia stem cell hierarchy. Cold Spring Harb Symp Quant Biol. 2008;73:439–449. - PubMed

Publication types

MeSH terms

Substances