

Roles of Transcriptional and Translational Control Mechanisms in Regulation of Ribosomal Protein Synthesis in Escherichia coli
- PMID: 28784818
- PMCID: PMC5626964
- DOI: 10.1128/JB.00407-17
Roles of Transcriptional and Translational Control Mechanisms in Regulation of Ribosomal Protein Synthesis in Escherichia coli
Abstract
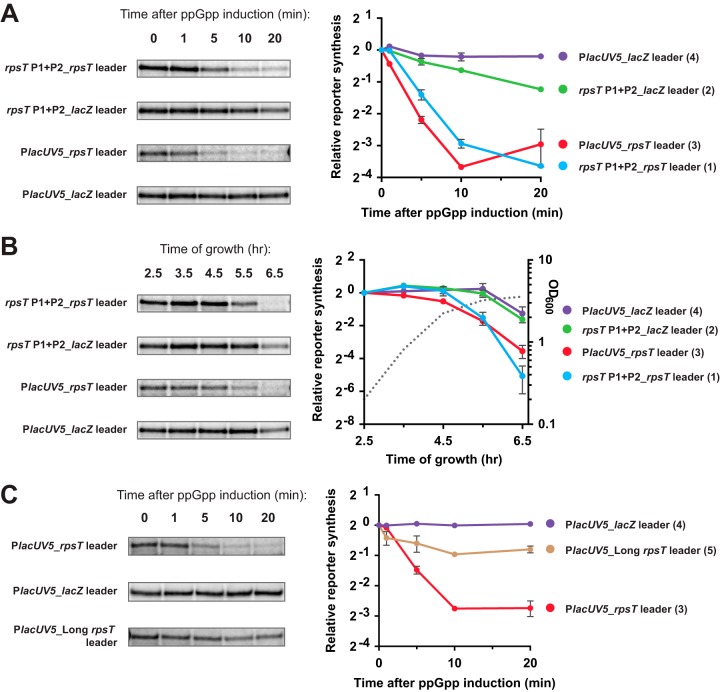
Bacterial ribosome biogenesis is tightly regulated to match nutritional conditions and to prevent formation of defective ribosomal particles. In Escherichia coli, most ribosomal protein (r-protein) synthesis is coordinated with rRNA synthesis by a translational feedback mechanism: when r-proteins exceed rRNAs, specific r-proteins bind to their own mRNAs and inhibit expression of the operon. It was recently discovered that the second messenger nucleotide guanosine tetra and pentaphosphate (ppGpp), which directly regulates rRNA promoters, is also capable of regulating many r-protein promoters. To examine the relative contributions of the translational and transcriptional control mechanisms to the regulation of r-protein synthesis, we devised a reporter system that enabled us to genetically separate the cis-acting sequences responsible for the two mechanisms and to quantify their relative contributions to regulation under the same conditions. We show that the synthesis of r-proteins from the S20 and S10 operons is regulated by ppGpp following shifts in nutritional conditions, but most of the effect of ppGpp required the 5' region of the r-protein mRNA containing the target site for translational feedback regulation and not the promoter. These results suggest that most regulation of the S20 and S10 operons by ppGpp following nutritional shifts is indirect and occurs in response to changes in rRNA synthesis. In contrast, we found that the promoters for the S20 operon were regulated during outgrowth, likely in response to increasing nucleoside triphosphate (NTP) levels. Thus, r-protein synthesis is dynamic, with different mechanisms acting at different times.IMPORTANCE Bacterial cells have evolved complex and seemingly redundant strategies to regulate many high-energy-consuming processes. In E. coli, synthesis of ribosomal components is tightly regulated with respect to nutritional conditions by mechanisms that act at both the transcription and translation steps. In this work, we conclude that NTP and ppGpp concentrations can regulate synthesis of ribosomal proteins, but most of the effect of ppGpp is indirect as a consequence of translational feedback in response to changes in rRNA levels. Our results illustrate how effects of seemingly redundant regulatory mechanisms can be separated in time and that even when multiple mechanisms act concurrently their contributions are not necessarily equivalent.
Keywords: autogenous control; ppGpp; regulation of promoter activity; ribosome synthesis; stringent response; translational feedback regulation.
Copyright © 2017 American Society for Microbiology.
Figures


Similar articles
-
Regulation of Ribosomal Protein Operons rplM-rpsI, rpmB-rpmG, and rplU-rpmA at the Transcriptional and Translational Levels.J Bacteriol. 2016 Aug 25;198(18):2494-502. doi: 10.1128/JB.00187-16. Print 2016 Sep 15. J Bacteriol. 2016. PMID: 27381917 Free PMC article.
-
Guanosine 3'-diphosphate 5'-diphosphate is not required for growth rate-dependent control of rRNA synthesis in Escherichia coli.Proc Natl Acad Sci U S A. 1990 Jul;87(14):5533-7. doi: 10.1073/pnas.87.14.5533. Proc Natl Acad Sci U S A. 1990. PMID: 2196571 Free PMC article.
-
Physiological analysis of the stringent response elicited in an extreme thermophilic bacterium, Thermus thermophilus.J Bacteriol. 2006 Oct;188(20):7111-22. doi: 10.1128/JB.00574-06. J Bacteriol. 2006. PMID: 17015650 Free PMC article.
-
Regulation of ribosomal RNA synthesis in E. coli: effects of the global regulator guanosine tetraphosphate (ppGpp).J Mol Microbiol Biotechnol. 2002 May;4(3):331-40. J Mol Microbiol Biotechnol. 2002. PMID: 11931566 Review.
-
Control of ribosome synthesis during the cell division cycles of E. coli and Synechococcus.Curr Issues Mol Biol. 2005 Jan;7(1):109-17. Curr Issues Mol Biol. 2005. PMID: 15580783 Review.
Cited by
-
Down-regulation of the bacterial protein biosynthesis machinery in response to weeks, years, and decades of soil warming.Sci Adv. 2022 Mar 25;8(12):eabm3230. doi: 10.1126/sciadv.abm3230. Epub 2022 Mar 25. Sci Adv. 2022. PMID: 35333567 Free PMC article.
-
Robust regulation of transcription pausing in Escherichia coli by the ubiquitous elongation factor NusG.Proc Natl Acad Sci U S A. 2023 Jun 13;120(24):e2221114120. doi: 10.1073/pnas.2221114120. Epub 2023 Jun 5. Proc Natl Acad Sci U S A. 2023. PMID: 37276387 Free PMC article.
-
Yersinia pseudotuberculosis growth arrest during type-III secretion system expression is associated with altered ribosomal protein expression and decreased gentamicin susceptibility.PLoS Pathog. 2025 Jul 7;21(7):e1012548. doi: 10.1371/journal.ppat.1012548. eCollection 2025 Jul. PLoS Pathog. 2025. PMID: 40623067 Free PMC article.
-
Transcriptional Responses to ppGpp and DksA.Annu Rev Microbiol. 2018 Sep 8;72:163-184. doi: 10.1146/annurev-micro-090817-062444. Annu Rev Microbiol. 2018. PMID: 30200857 Free PMC article. Review.
-
In Vitro Studies of Persister Cells.Microbiol Mol Biol Rev. 2020 Nov 11;84(4):e00070-20. doi: 10.1128/MMBR.00070-20. Print 2020 Nov 18. Microbiol Mol Biol Rev. 2020. PMID: 33177189 Free PMC article. Review.
References
MeSH terms
Substances
Grants and funding
LinkOut - more resources
Full Text Sources
Other Literature Sources
