

A non-invasive magnetic resonance imaging approach for assessment of real-time microcirculation dynamics
- PMID: 28784990
- PMCID: PMC5547069
- DOI: 10.1038/s41598-017-06983-6
A non-invasive magnetic resonance imaging approach for assessment of real-time microcirculation dynamics
Abstract
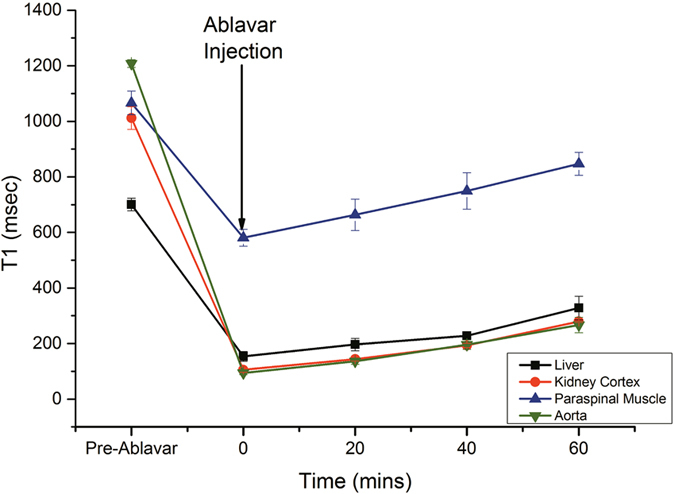
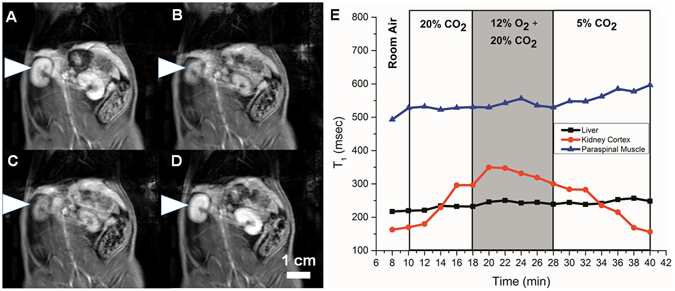
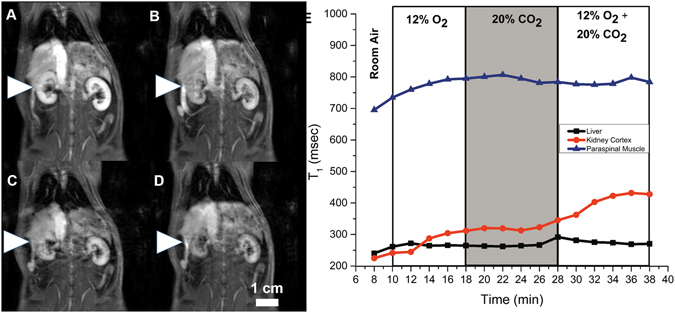
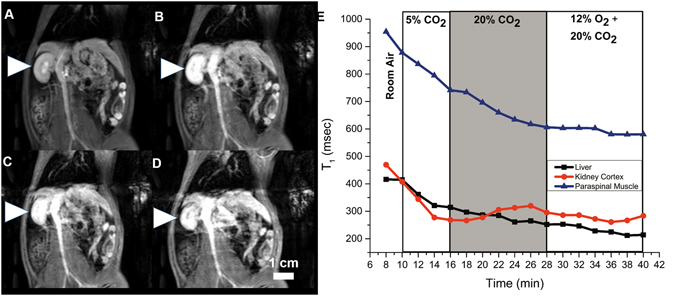
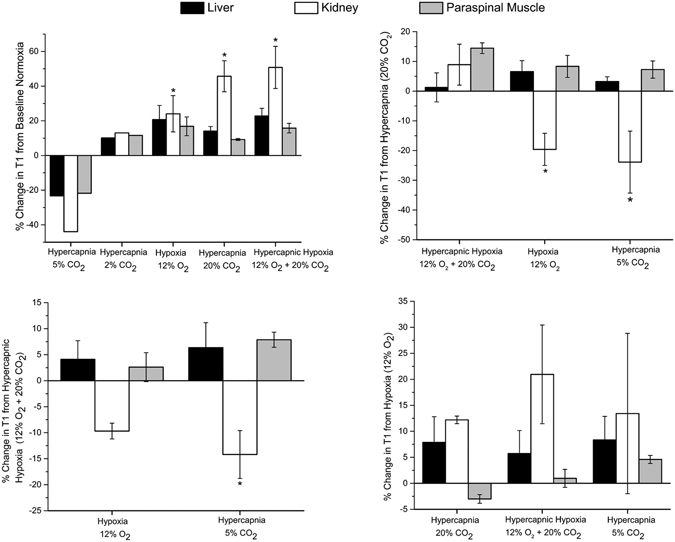
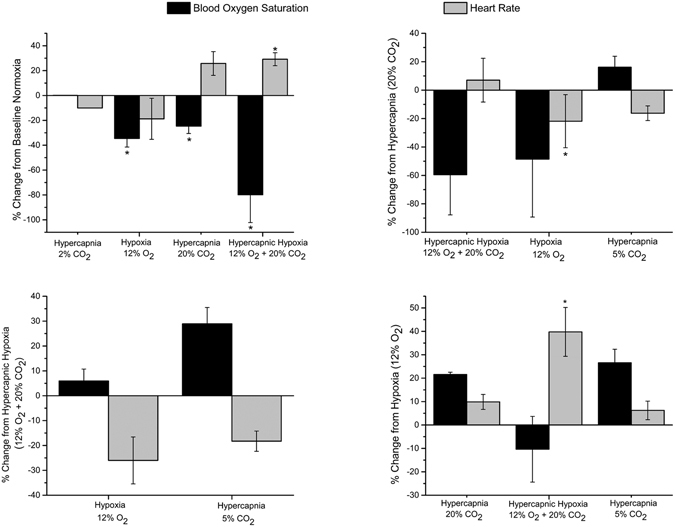
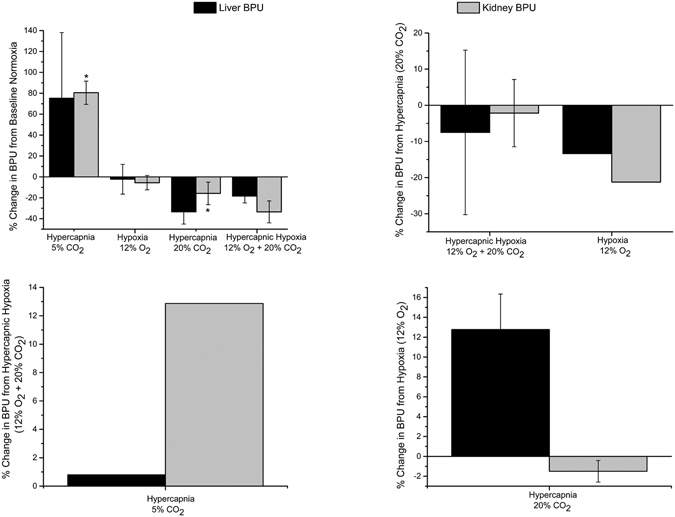
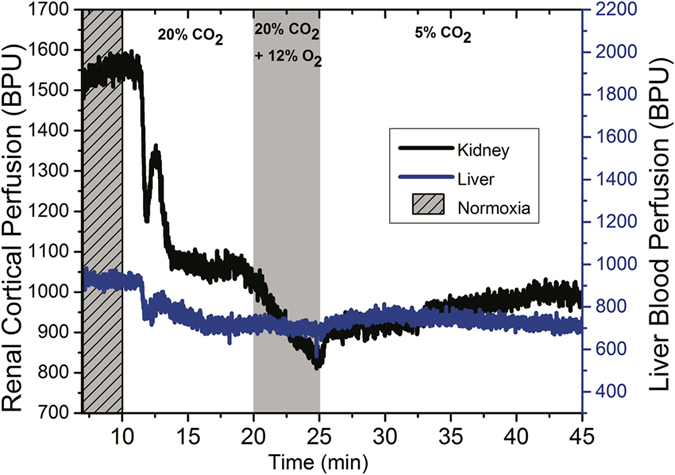
We present a novel, non-invasive magnetic resonance imaging (MRI) technique to assess real-time dynamic vasomodulation of the microvascular bed. Unlike existing perfusion imaging techniques, our method is sensitive only to blood volume and not flow velocity. Using graded gas challenges and a long-life, blood-pool T 1-reducing agent gadofosveset, we can sensitively assess microvascular volume response in the liver, kidney cortex, and paraspinal muscle to vasoactive stimuli (i.e. hypercapnia, hypoxia, and hypercapnic hypoxia). Healthy adult rats were imaged on a 3 Tesla scanner and cycled through 10-minute gas intervals to elicit vasoconstriction followed by vasodilatation. Quantitative T 1 relaxation time mapping was performed dynamically; heart rate and blood oxygen saturation were continuously monitored. Laser Doppler perfusion measurements confirmed MRI findings: dynamic changes in T 1 corresponded with perfusion changes to graded gas challenges. Our new technique uncovered differential microvascular response to gas stimuli in different organs: for example, mild hypercapnia vasodilates the kidney cortex but constricts muscle vasculature. Finally, we present a gas challenge protocol that produces a consistent vasoactive response and can be used to assess vasomodulatory capacity. Our imaging approach to monitor real-time vasomodulation may be extended to other imaging modalities and is valuable for investigating diseases where microvascular health is compromised.
Conflict of interest statement
The authors declare that they have no competing interests.
Figures
Similar articles
-
Blood-pool MRI assessment of myocardial microvascular reactivity.Front Cardiovasc Med. 2023 Nov 1;10:1216587. doi: 10.3389/fcvm.2023.1216587. eCollection 2023. Front Cardiovasc Med. 2023. PMID: 38028477 Free PMC article.
-
A novel MRI analysis for assessment of microvascular vasomodulation in low-perfusion skeletal muscle.Sci Rep. 2020 Mar 13;10(1):4705. doi: 10.1038/s41598-020-61682-z. Sci Rep. 2020. PMID: 32170106 Free PMC article.
-
Assessment of microvascular dysfunction in acute limb ischemia-reperfusion injury.J Magn Reson Imaging. 2019 Apr;49(4):1174-1185. doi: 10.1002/jmri.26308. Epub 2018 Oct 9. J Magn Reson Imaging. 2019. PMID: 30302854
-
Impact of experimental conditions on noncontact laser recordings in microvascular studies.Microcirculation. 2012 Nov;19(8):669-75. doi: 10.1111/j.1549-8719.2012.00205.x. Microcirculation. 2012. PMID: 22708898 Review.
-
Specific features and roles of renal circulation: angiotensin II revisited.J Physiol Pharmacol. 2006 Nov;57 Suppl 11:169-78. J Physiol Pharmacol. 2006. PMID: 17244948 Review.
Cited by
-
Blood-pool MRI assessment of myocardial microvascular reactivity.Front Cardiovasc Med. 2023 Nov 1;10:1216587. doi: 10.3389/fcvm.2023.1216587. eCollection 2023. Front Cardiovasc Med. 2023. PMID: 38028477 Free PMC article.
-
Survey of water proton longitudinal relaxation in liver in vivo.MAGMA. 2021 Dec;34(6):779-789. doi: 10.1007/s10334-021-00928-x. Epub 2021 May 12. MAGMA. 2021. PMID: 33978944 Free PMC article. Review.
-
Abnormal skeletal muscle and myocardial vasoreactivity manifests prior to heart failure in a diabetic cardiomyopathy rat model.Discov Med (Singap). 2025;2(1):2. doi: 10.1007/s44337-025-00192-1. Epub 2025 Jan 6. Discov Med (Singap). 2025. PMID: 39781423 Free PMC article.
-
Comparison of Diagnostic Value Between STE+LDDSE and CMR-FT for Evaluating Coronary Microvascular Obstruction in Post-PCI Patients for STEMI.Ther Clin Risk Manag. 2022 Aug 15;18:813-823. doi: 10.2147/TCRM.S374866. eCollection 2022. Ther Clin Risk Manag. 2022. PMID: 35996553 Free PMC article.
-
Heart failure with preserved ejection fraction: the missing pieces in diagnostic imaging.Heart Fail Rev. 2020 Mar;25(2):305-319. doi: 10.1007/s10741-019-09836-8. Heart Fail Rev. 2020. PMID: 31364028 Review.
References
Publication types
MeSH terms
Substances
LinkOut - more resources
Full Text Sources
Other Literature Sources
Medical
