

Income inequality, gene expression, and brain maturation during adolescence
- PMID: 28784996
- PMCID: PMC5547165
- DOI: 10.1038/s41598-017-07735-2
Income inequality, gene expression, and brain maturation during adolescence
Abstract
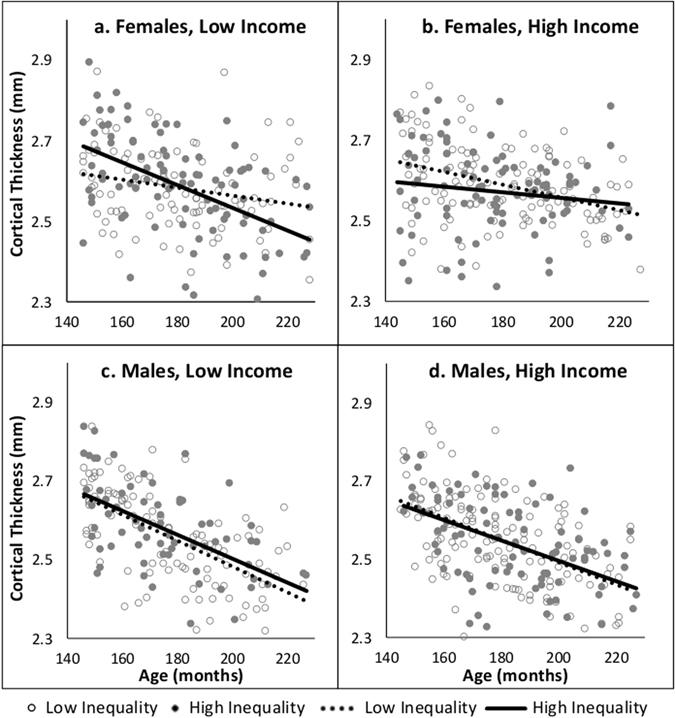
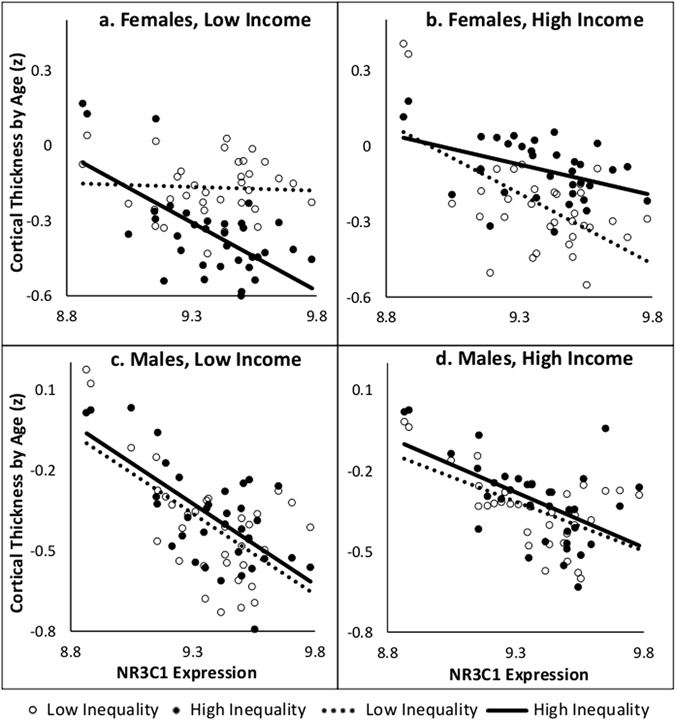
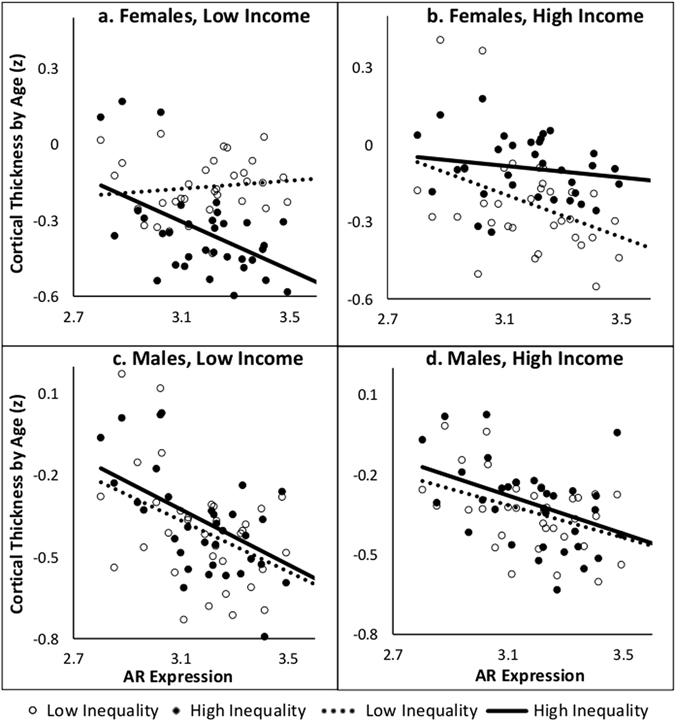
Income inequality is associated with poor health and social outcomes. Negative social comparisons and competition may involve the hypothalamic-pituitary-adrenal (HPA) and hypothalamic-pituitary-gonadal (HPG) axes in underlying some of these complex inter-relationships. Here we investigate brain maturation, indexed by age-related decreases in cortical thickness, in adolescents living in neighborhoods with differing levels of income inequality and household income. We examine whether inter-regional variations relate to those in glucocorticoid receptor (HPA) and androgen receptor (HPG) gene expression. For each sex, we used a median split of income inequality and household income (income-to-needs ratio) to create four subgroups. In female adolescents, the high-inequality low-income group displayed the greatest age-related decreases in cortical thickness. In this group, expression of glucocorticoid and androgen receptor genes explained the most variance in these age-related decreases in thickness across the cortex. We speculate that female adolescents living in high-inequality neighborhoods and low-income households may experience greater HPA and HPG activity, leading to steeper decreases in cortical thickness with age.
Conflict of interest statement
The authors declare that they have no competing interests.
Figures
Similar articles
-
Inter-Regional Variations in Gene Expression and Age-Related Cortical Thinning in the Adolescent Brain.Cereb Cortex. 2018 Apr 1;28(4):1272-1281. doi: 10.1093/cercor/bhx040. Cereb Cortex. 2018. PMID: 28334178 Free PMC article.
-
Hypothalamic-pituitary-adrenal and hypothalamic-pituitary-gonadal axes: sex differences in regulation of stress responsivity.Stress. 2017 Sep;20(5):476-494. doi: 10.1080/10253890.2017.1369523. Epub 2017 Aug 31. Stress. 2017. PMID: 28859530 Free PMC article. Review.
-
Orexin receptor expression in the hypothalamic-pituitary-adrenal and hypothalamic-pituitary-gonadal axes of free-living European beavers (Castor fiber L.) in different periods of the reproductive cycle.Gen Comp Endocrinol. 2017 Jan 1;240:103-113. doi: 10.1016/j.ygcen.2016.09.013. Epub 2016 Sep 21. Gen Comp Endocrinol. 2017. PMID: 27664717
-
Sex differences in early-life programming of the hypothalamic-pituitary-adrenal axis in humans.Early Hum Dev. 2017 Nov;114:7-10. doi: 10.1016/j.earlhumdev.2017.09.011. Epub 2017 Sep 15. Early Hum Dev. 2017. PMID: 28927573 Review.
-
Ontogeny of hypothalamic glucocorticoid receptor-mediated inhibition of the hypothalamic-pituitary-adrenal axis in mice.Stress. 2015;18(4):400-7. doi: 10.3109/10253890.2015.1046832. Epub 2015 Jun 11. Stress. 2015. PMID: 26068518 Free PMC article.
Cited by
-
Immigration Status, Socioeconomic Status, and Self-Rated Health in Europe.Int J Environ Res Public Health. 2022 Nov 25;19(23):15657. doi: 10.3390/ijerph192315657. Int J Environ Res Public Health. 2022. PMID: 36497731 Free PMC article.
-
Corticosteroids and Regional Variations in Thickness of the Human Cerebral Cortex across the Lifespan.Cereb Cortex. 2020 Mar 21;30(2):575-586. doi: 10.1093/cercor/bhz108. Cereb Cortex. 2020. PMID: 31240317 Free PMC article.
-
Family Income Mediates the Effect of Parental Education on Adolescents' Hippocampus Activation During an N-Back Memory Task.Brain Sci. 2020 Aug 5;10(8):520. doi: 10.3390/brainsci10080520. Brain Sci. 2020. PMID: 32764344 Free PMC article.
-
Life-course neighbourhood deprivation and brain structure in older adults: the Lothian Birth Cohort 1936.Mol Psychiatry. 2024 Nov;29(11):3483-3494. doi: 10.1038/s41380-024-02591-9. Epub 2024 May 21. Mol Psychiatry. 2024. PMID: 38773266 Free PMC article.
-
Neighborhood income inequality, maternal relative deprivation and neonatal health in Sweden: A cross-sectional study using individually defined multi-scale contexts.SSM Popul Health. 2024 Dec 29;29:101745. doi: 10.1016/j.ssmph.2024.101745. eCollection 2025 Mar. SSM Popul Health. 2024. PMID: 39850955 Free PMC article.
References
Publication types
MeSH terms
Substances
LinkOut - more resources
Full Text Sources
Other Literature Sources
