. 2017 Aug 7;7(1):7389.
doi: 10.1038/s41598-017-06708-9.

Mapping sulphadoxine-pyrimethamine-resistant Plasmodium falciparum malaria in infected humans and in parasite populations in Africa

Affiliations

Mapping sulphadoxine-pyrimethamine-resistant Plasmodium falciparum malaria in infected humans and in parasite populations in Africa

Lucy C Okell et al. Sci Rep. .

Abstract

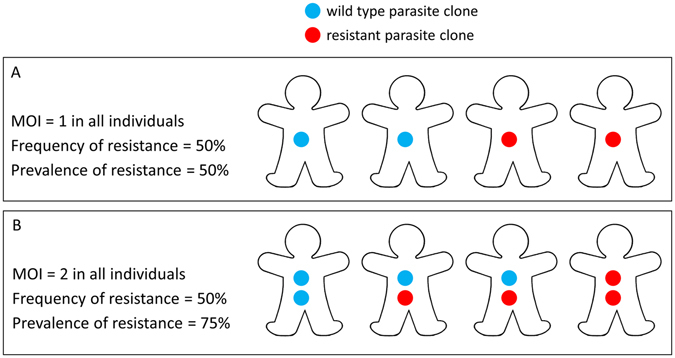
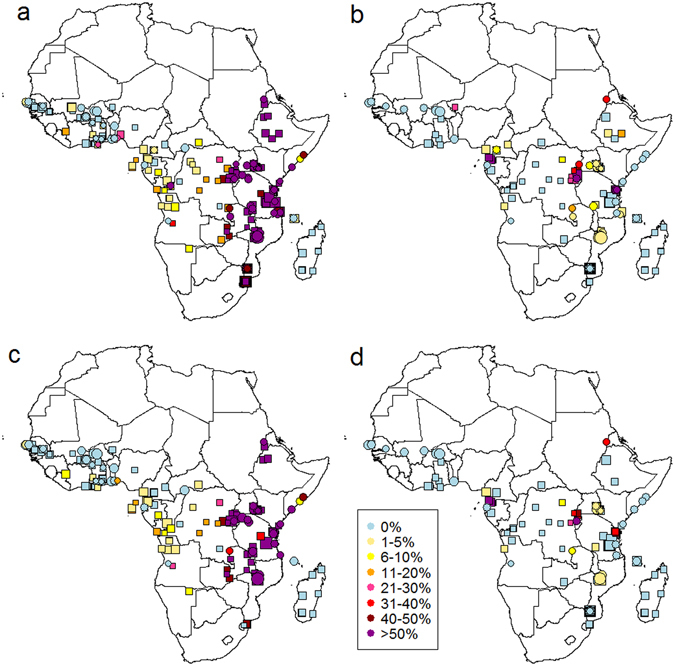
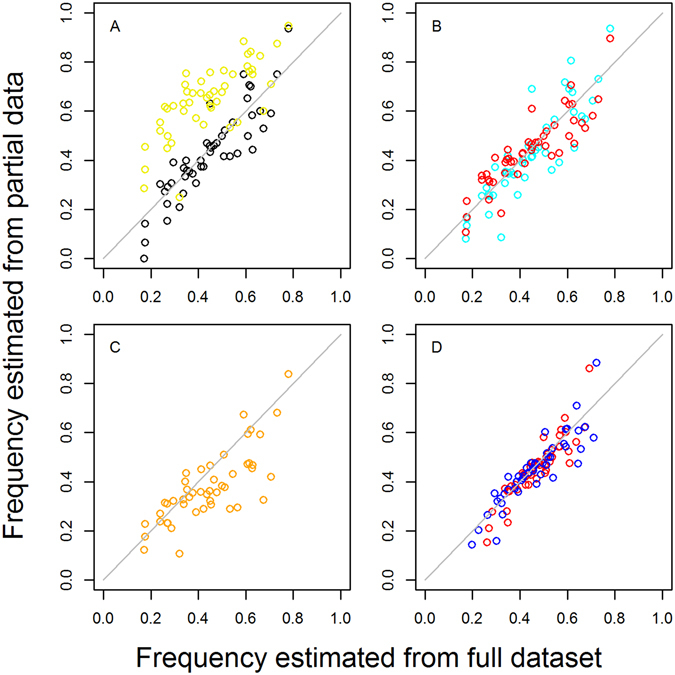
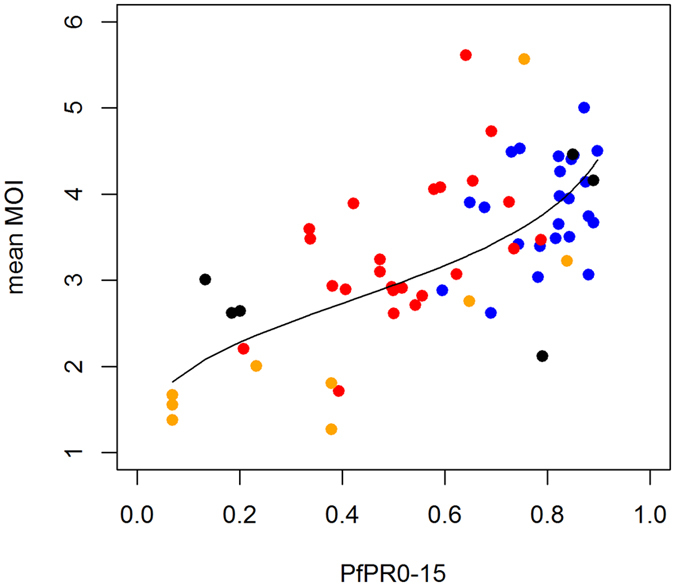
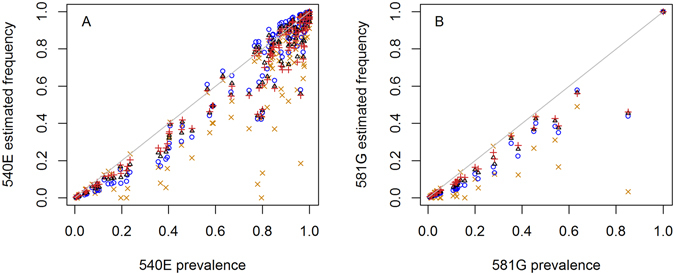
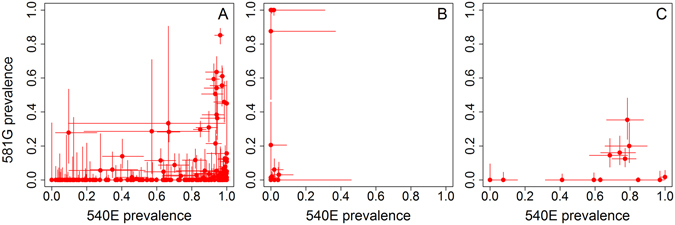
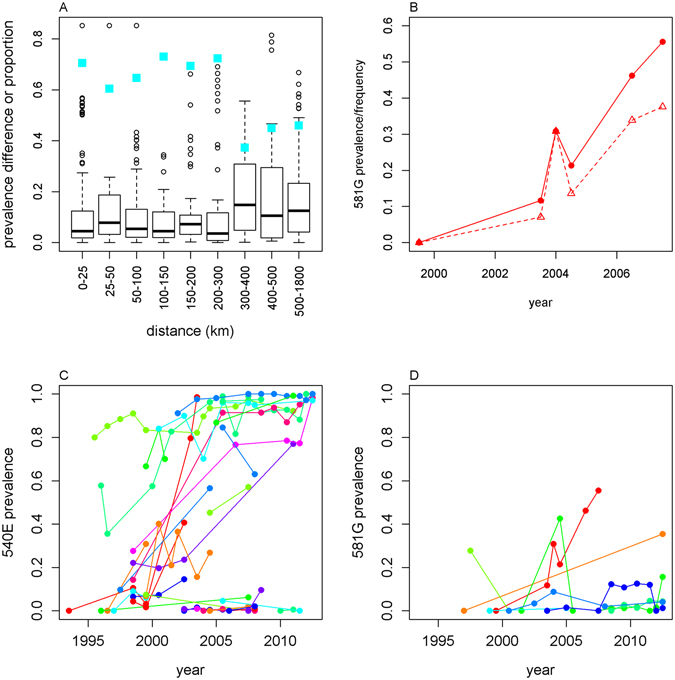
Intermittent preventive treatment (IPT) with sulphadoxine-pyrimethamine in vulnerable populations reduces malaria morbidity in Africa, but resistance mutations in the parasite dhps gene (combined with dhfr mutations) threaten its efficacy. We update a systematic review to map the prevalence of K540E and A581G mutations in 294 surveys of infected humans across Africa from 2004-present. Interpreting these data is complicated by multiclonal infections in humans, especially in high transmission areas. We extend statistical methods to estimate the frequency, i.e. the proportion of resistant clones in the parasite population at each location, and so standardise for varying transmission levels. Both K540E and A581G mutations increased in prevalence and frequency in 60% of areas after 2008, highlighting the need for ongoing surveillance. Resistance measures within countries were similar within 300 km, suggesting an appropriate spatial scale for surveillance. Spread of the mutations tended to accelerate once their prevalence exceeded 10% (prior to fixation). Frequencies of resistance in parasite populations are the same or lower than prevalence in humans, so more areas would be classified as likely to benefit from IPT if similar frequency thresholds were applied. We propose that the use of resistance frequencies as well as prevalence measures for policy decisions should be evaluated.


Conflict of interest statement

The authors declare that they have no competing interests.

Figures

Figure 1
Figure 1
The difference between the prevalence of resistance in the infected human population (% of individuals carrying at least one resistant parasite clone) and the frequency of resistance in the parasite population (% of parasite clones which are resistant). If each individual carries only one parasite clone (a multiplicity of infection (MOI) of 1) (A), then the frequency and prevalence of resistance are the same. However in most areas, particularly areas with high malaria transmission intensity, individuals carry multiple parasite clones, so that the frequency and prevalence of resistance are often not the same. For example, if everyone in an area carries 2 parasite clones (B), and the frequency of resistance in the parasite population is 50%, then the prevalence of resistance in humans would be 75% if clones are distributed randomly. The prevalence of resistance in humans is almost always higher than the frequency of resistance in the parasite population due to multi-clonal infections. In reality, individuals in a malaria-endemic area carry different numbers of parasite clones (which we allow for in the analyses presented in the Methods and Results sections).
Figure 2
Figure 2
Prevalence of dhps (A) 540E and (B) 581G in infected individuals and estimated frequencies of (C) 540E and (D) 581G mutations in parasite populations in Africa 2004–2008 (squares) and 2009–2013 (circles) (see also Supplementary data 1 and 2). Data point size is proportional to sample size, with most recent data on top. (A) 540E prevalence was assessed in 294 surveys in 32 countries since 2004, of which only 6 did not detect the mutant at all: Burkina Faso, Gambia, Côte d’Ivoire, Madagascar, Niger, Swaziland. Nine countries detected 540E prevalence >50%: Sudan, Somalia, the Republic of the Congo, Tanzania, Malawi, Kenya, DRC, Mozambique, Ethiopia, Rwanda, Uganda and Zambia. (B) 581G prevalence was assessed in 147 surveys in 26 countries, of which 13 countries detected the mutation: Angola, Cameroon, Democratic Republic of the Congo, Ethiopia, Equatorial Guinea, Kenya, Malawi, Niger, Rwanda, Sudan, Tanzania, Uganda and Zambia. (C and D) Frequencies are shown only for surveys which reported the prevalence of mixed infections (27% of total surveys), or estimated frequency by excluding mixed infections from analysis (21%), or had zero prevalence (32%). Surveys which counted mixed infections as mutants (11%), or did not specify how mixed infections were dealt with (8%) were excluded. Frequencies are estimated using Method 5C (Methods section, equation 8), assuming the probability of detecting each clone was 0.54. Maps were generated in R software version 3.1.3, and are based on 180 publications (62 since 2011). Similar patterns are confirmed by an independent review of 35 publications carried out after our review was complete.
Figure 3
Figure 3
Estimating mutant frequencies in parasite populations: validation of different methods using 540E and MOI data from cross-sectional surveys of 5131 people in 2004 and 2007 in 24 divisions in Tanzania. Ideally, frequencies are estimated using detailed data from all infected individuals on their MOI and whether an infection is pure resistant, pure wild type or mixed. We plot 540E frequencies estimated using only partial data, such as is more often available from routine surveillance of mutations (Methods 3–5), against frequencies estimated from this full dataset for each location (Method 2; x axis on all panels) : (A) black points: 540E frequencies estimated by excluding mixed infections (Method 1A vs Method 2A); yellow points: for comparison we also show the prevalence of any 540E mutation among infected individuals (B) blue points: 540E frequencies estimated from data on mixed infections and mean population MOI (Method 3A vs Method 2A); red points: 540E frequencies estimated from data on mixed infections but with no MOI data (Method 5A vs Method 2A), instead estimating mean MOI using the Malaria Atlas Project slide prevalence and the relationship in Fig. 4 (C) orange points: 540E frequencies estimated with no MOI data nor data on mixed infections, using data on resistance prevalence only (Method 8A vs Method 2A) (D) red points: 540E frequencies estimated with data on mixed infections but no MOI data when detection of clones is imperfect, either assuming clones are missed in high MOI infections (Method 5B vs Method 2B) or (blue points) clones have a constant probability of being missed in any infection (Method 5C vs Method 2C).
Figure 4
Figure 4
Relationship between slide-prevalence of infection in 0–15 year olds (PfPR0–15) and the mean multiplicity of infection (MOI) in infected individuals in 63 sites. Data (points) and model fit (black line). Data are: (blue) asymptomatic individuals in the test datset in Tanzania in 2004 and (red) 2007; (orange) data from a previous review in multiple sites containing both symptomatic and asymptomatic individuals; and (black) from symptomatic patients in Uganda. 48 of the measures had simultaneous measures of slide-prevalence, while the other 15 were paired with an alternative measure of transmission intensity, the entomological inoculation rate (EIR, number of infectious bites per person per year). We converted the EIR values to slide-prevalence values in 0–15 year olds, using a previously published relationship. Model fit (black line) is from linear regression of log MOI against the log odds of PfPR0–15. The best fitting relationship is log MOI = 1.082 + 0.185*logit(PfPR0–15). This is further confirmed with a similar relationship fitted in a separate review and mathematical modelling paper published after our analysis was complete.
Figure 5
Figure 5
Prevalence of (A) 540E and (B) 581G mutations in the systematic review data compared with frequencies in the parasite population estimated by different methods: simple counting of mutant samples excluding mixed infections (orange crosses; Method 1A); by assuming 100% detection of clones (blue circles; Method 5A); by assuming detection is independent of MOI (Method 5C) with a probability of detection per clone of 0.54 (black triangles); or 0.3 (red vertical crosses). Surveys were included in these figures if they detected the mutant and reported the prevalence of mixed wild type-resistant infections.
Figure 6
Figure 6
Relationship between prevalence of 540E and 581G mutations when measured in the same individuals in (A) Eastern and Southern Africa (n = 172), (B) West Africa (n = 50), (C) Northeast Africa (n = 15) using surveys from 1988–2013. Mixed infections contribute to some of these measures, therefore the haplotype is unknown for most samples (i.e. the two mutations could be present together on one parasite or separately on different parasites). The sample size for assessing the prevalence of the two mutations was not always identical, usually due to different PCR success rates. Data in Eastern and Southern Africa were from the Democratic Republic of the Congo, Kenya, Mozambique, Malawi, Rwanda, Tanzania, Uganda, South Africa and Zambia; in West Africa from Angola, Benin, Burkina Faso, Côte d’Ivoire, Cameroon, Ghana, Equatorial Guinea, Mali, Mauritania, Niger and Senegal; and Northeast Africa from Ethiopia, Sudan and Somalia.
Figure 7
Figure 7
Spatiotemporal variation in 540E and 581G prevalence. (A) Different spatial scales. We compared prevalence of the same mutation in the same country between surveys done within 1 year of each other. We plot the pairwise distance between the surveys against the absolute difference in prevalence of the mutation. Blue squares indicate the proportion of survey pairs in which the difference in mutation prevalence was less than 10%. (B) Comparison of 581G frequency (triangles, dashed line) and prevalence (circles, solid line) in Tanga, Tanzania. Temporal trends in (C) 540E and (D) 581G prevalence. We compared successive measures within the same first administrative area which were <100km apart. Supplementary Fig. S4 shows the same results for frequency measures. Comparisons of two zero prevalence measures are excluded in all panels.

References

    1. Picot S, et al. A systematic review and meta-analysis of evidence for correlation between molecular markers of parasite resistance and treatment outcome in falciparum malaria. Malar J. 2009;8:89. doi: 10.1186/1475-2875-8-89. - DOI - PMC - PubMed
    1. Chico RM, et al. Influence of malaria transmission intensity and the 581G mutation on the efficacy of intermittent preventive treatment in pregnancy: systematic review and meta-analysis. Trop Med Int Health. 2015;20:1621–1633. doi: 10.1111/tmi.12595. - DOI - PubMed
    1. Omar SA, Adagu IS, Warhurst DC. Can pretreatment screening for dhps and dhfr point mutations in Plasmodium falciparum infections be used to predict sulfadoxine-pyrimethamine treatment failure? Trans R Soc Trop Med Hyg. 2001;95:315–319. doi: 10.1016/S0035-9203(01)90250-0. - DOI - PubMed
    1. Staedke SG, et al. Relationship between age, molecular markers, and response to sulphadoxine-pyrimethamine treatment in Kampala, Uganda. Trop Med Int Health. 2004;9:624–629. doi: 10.1111/j.1365-3156.2004.01239.x. - DOI - PubMed
    1. Kublin JG, et al. Molecular markers for failure of sulfadoxine-pyrimethamine and chlorproguanil-dapsone treatment of Plasmodium falciparum malaria. J Infect Dis. 2002;185:380–388. doi: 10.1086/338566. - DOI - PubMed

Publication types

MeSH terms