Meta-Analysis
. 2017 Aug 7;7(1):7480.
doi: 10.1038/s41598-017-07490-4.

The HIV Genomic Incidence Assay Meets False Recency Rate and Mean Duration of Recency Infection Performance Standards

Affiliations
Meta-Analysis

The HIV Genomic Incidence Assay Meets False Recency Rate and Mean Duration of Recency Infection Performance Standards

Sung Yong Park et al. Sci Rep. .

Abstract

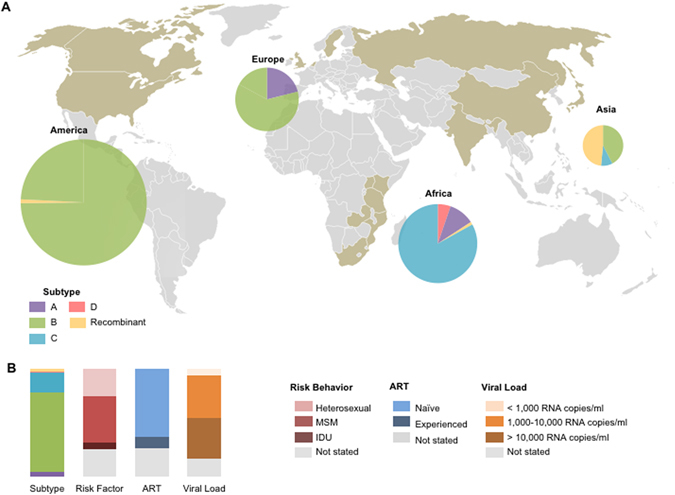
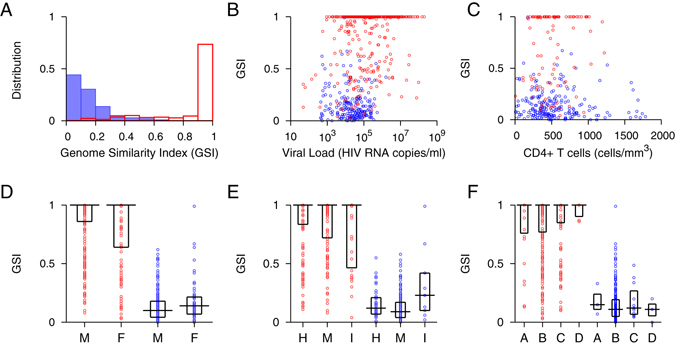
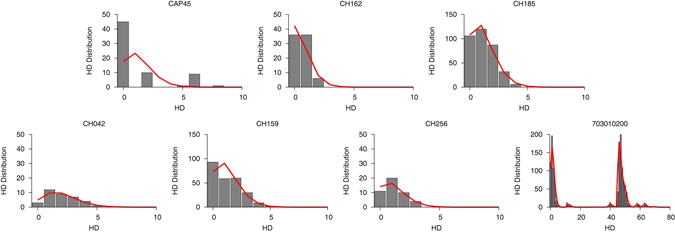
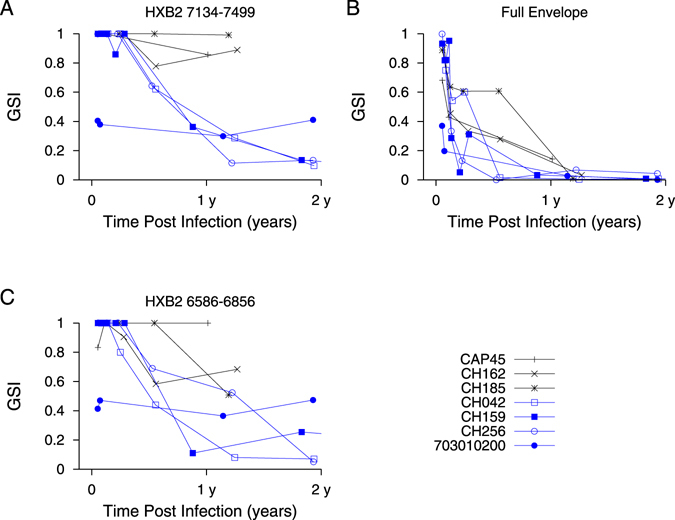
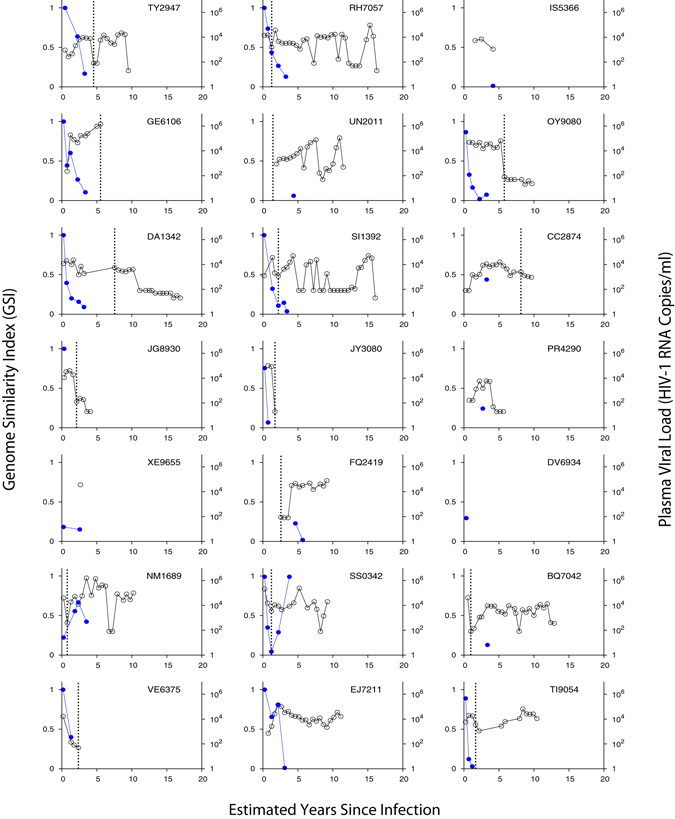
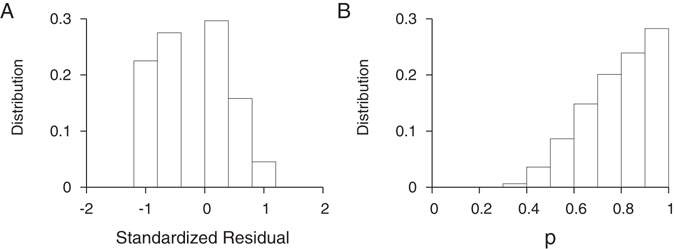
HIV incidence is a primary metric for epidemic surveillance and prevention efficacy assessment. HIV incidence assay performance is evaluated via false recency rate (FRR) and mean duration of recent infection (MDRI). We conducted a meta-analysis of 438 incident and 305 chronic specimens' HIV envelope genes from a diverse global cohort. The genome similarity index (GSI) accurately characterized infection stage across diverse host and viral factors. All except one chronic specimen had GSIs below 0.67, yielding a FRR of 0.33 [0-0.98] %. We modeled the incidence assay biomarker dynamics with a logistic link function assuming individual variabilities in a Beta distribution. The GSI probability density function peaked close to 1 in early infection and 0 around two years post infection, yielding MDRI of 420 [361, 467] days. We tested the assay by newly sequencing 744 envelope genes from 59 specimens of 21 subjects who followed from HIV negative status. Both standardized residuals and Anderson-Darling tests showed that the test dataset was statistically consistent with the model biomarker dynamics. This is the first reported incidence assay meeting the optimal FRR and MDRI performance standards. Signatures of HIV gene diversification can allow precise cross-sectional surveillance with a desirable temporal range of incidence detection.


Conflict of interest statement

The authors declare that they have no competing interests.

Figures

Figure 1
Figure 1
Global cohort characteristics (A). Geographic and subtype distribution of 805 specimens from the shaded (taupe) countries. These specimens are further described in Tables 1 and S1–S5. Pie charts indicate the subtype of included specimens, where the diameter denotes the proportional representation of each continent to the total specimen. The map was generated by Microsoft PowerPoint (Version 15.30) using a template available at https://commons.wikimedia.org/wiki/File:Color_world_map.png which is released into the public domain at Wikimedia Commons, free media repository. (B). The profiles of the 805 specimens’ subtype, risk behaviors, ART status, and viral load.
Figure 2
Figure 2
Genome Similarity Index (GSI) of incident and chronic infections. (A) The GSI distribution of 438 incident specimens is presented in red boxes and that of 305 chronic specimens in blue. The 305 chronic specimens include 274 chronic specimens listed in Table S1, 8 chronic specimens from the longitudinal cohort in Table S3 and 23 chronic specimens from the WIHS cohort in Table 1. The 438 incident specimens consist of 252 single time point incident specimens in Table S2 and 186 incident specimens from the longitudinal cohort in Table S3. All chronic specimens were collected from subjects documented to have been HIV-1 infected for over two years, and all incident specimens were collected within 2 years of HIV-1 infections, according to Fiebig staging and sampling intervals. The two distributions were clearly polarized; the majority of incident subjects had GSIs above 0.9, while all chronic subjects except one had GSIs below 0.67. (B) GSI and viral load for incident (red) and chronic (blue) specimens where viral load was available. Viral load did not significantly correlate with 207 chronic specimens’ GSI (Spearman’s correlation ρ = −0.069 and p = 0.32) but associated with 433 incident GSI (Spearman’s correlation ρ = 0.17 and p < 0.01) although, as indicated by a small correlation coefficient, this association was weak. (C) GSI and CD4 + T cell count where available were not statistically correlated in either 104 incident (red) or 209 chronic (blue) specimens (Spearman’s correlation ρ = 0.12 and p = 0.24 and ρ = −0.11 and p = 0.11, respectively). (D) GSI of male (M) and female (F) incident (red) and chronic (blue) specimens. Box plots represent median and first and third quartiles. Incident specimen’s GSI was not sensitive to sex (299 male vs. 142 female, Wilcoxon rank sum test, p = 0.22), but chronic GSI was sensitive (Wilcoxon rank sum test, p = 0.024), presumably due to unbalanced sample size (226 male vs. 55 female) as suggested by overlapping quartiles. In a permutation test, this association was nonsignificant (p = 0.076). (E) GSI of incident (red) and chronic (blue) specimens from different risk groups (H: heterosexual, M: men who have sex with men, I: intravenous drug user). Incident GSI was not sensitive to risk behavior (156 heterosexual vs. 143 MSM vs. 34 IDU, Kruskal-Wallis tests, p = 0.094), but chronic GSI was sensitive (Kruskal-Wallis test, p = 0.015), likely due to unbalanced sample size (46 heterosexual vs. 201 MSM vs. 9 IDU). The p-value was 0.009 in a permutation test. (F) GSI for incident (red) and chronic (blue) specimens of subtype A, B, C, and D. Neither incident (31 subtype A, 279 subtype B, 134 subtype C, and 6 subtype D) nor chronic (3 subtype A, 280 subtype B, 11 subtype C, and 3 subtype D) GSIs differed significantly among subtypes (Kruskal-Wallis test, p = 0.61 and p = 0.70, respectively).
Figure 3
Figure 3
Genomic biomarker dynamics over time. (A) GSI dynamics of 194 longitudinal and 252 single time point incident specimens along with the beta distribution model fit. Forty three subjects in Table S3 were serially followed from Fiebig stage I-V (circles with black solid lines) and 252 single time point incident specimens were collected at Fiebig stage I-V (circles), as presented in Table S2. The GSI varies between individuals, but in the majority of cases is close to one for new infections and drops towards zero over time. The average biomarker dynamics were modeled by logistic link function and the variation between individuals was modeled by the beta distribution as in Eqs (2–3). The best fit of the model for the average GSI dynamics (solid red curve) and its 95% confidence intervals (CI) (dashed red curves) are presented. The maximum likelihood estimates of the model parameters are M = 495.8 [415.1–575.6], S = 176.8 [124.3–239.7], V = 0.96 [0.86–1.12] and c = 0.95 [0.94–0.96]. Each parameter’s 95% CI was obtained by resampling incident specimens’ biomarker data 10,000 times. The average biomarker’s 95% CI (dashed red curves) is the 95% CI of 10,000 fitted biomarker dynamics curves for each time point. (B) The density plot of the estimated GSI distribution over time. The GSI probability density function peaked (red) close to 1 during early infection and at 0 around two years post infection. However, around one year the density function peaked in both high and low GSI regions. These profiles collectively reflect the sequence data trends at the population level. The model estimate of the probability of being recent, defined in Eq. (4), is presented by a blue line and the proportion of subjects with GSI greater than the threshold in each one year bin is presented by black circles. The 95% CIs are presented by blue dashed curves and black lines, respectively. The beta distribution model was consistent with the one year bin evaluation. (D) The MDRI estimated by the model (blue), 420 [361–467] days, was compared with that from the bin-method (black), 378 [304–460] days.
Figure 4
Figure 4
The intersequence Hamming distance (HD) distribution (grey bars) of HIV-1 full envelope gene sequences obtained from each subject in the slow (CAP45, CH162, and CH185) and fast GSI dynamics groups (CH042, CH159, CH256, and 703010200) along with the best fit (red curve) of the Shifted Poisson Mixture Model (SPMM). The SPMM estimated a single founder variant for all subjects except subject 703010200, whose infection was estimated to originate from six founders (when two putative recombinant strains from subject 703010200 were excluded, the number of founders was estimated to be 4. Here the minimum distance between founder variants was set as 10). The infection duration estimated by SPMM for subject CAP45, CH162, CH185 in the slow group was 24.1 [12.2–35.9] (goodness of fit p < 0.0001), 11.0 [3.4–18.6] (p = 0.07) and 21.4 [13.9–28.8] (p = 0.49) days and for subject CH042, CH159, CH256, and 703010200 in the fast group was 35.7 [19.2–52.2] (p = 0.90), 22.8 [14.4–31.1] (p = 0.002), 21.0 [8.9–33.1] (p = 0.66) and 28.4 [22.2–34.5] (p < 0.0001) days, respectively. The SPMM fits’ sum of squared errors (SSE) and Akaike information criteria (AIC) were 0.33 (291.0), 0.024 (152.9), 0.0017 (966.7), 0.0078 (118.7), 0.022 (761.0), 0.011 (119.2), and 0.0055 (4098.1) for subject CAP45, CH162, CH185, CH042, CH159, CH256 and 703010200, respectively.
Figure 5
Figure 5
GSI dynamics in slow and fast decay groups. GSI dynamics of envelope gene segment HXB2 7134-7499 (A), full envelope gene (B), and envelope gene segment HXB2 6586-6856 (C) in slow (CAP45, CH162, and CH185) and fast (CH042, CH159, CH256, and 703010200) groups.
Figure 6
Figure 6
Genomic incidence assay biomarker and viral load dynamics of 21 WIHS longitudinally followed subjects. Each subject’s GSI is represented by blue filled dots and viral load by black empty dots. The GSI was measured from eight or more HIV-1 envelope gene segments (HXB2 7134-7499) from each specimen using Eq. (1). Years since infection was estimated by taking the mid-point between each subject’s last HIV negative date and first HIV positve date, and each subsequent sample collection date. The dotted black vertical line indicates ART initiation. Of 14 longitudinally sequenced subjects all except two subjects (NM1689 and SS0342) showed GSI decline over time as expected.
Figure 7
Figure 7
Biomarker dynamics validation. (A) The standardized residual of biomarkers of 31 incident specimens from 15 WIHS subjects. Each WIHS subject’s first specimen’s days post infection was randomly assigned within the maximum and minimum days post infection (Table 1) and subsequent specimens’ days post infection were based on specimen collection time intervals. This sampling was repeated 10,000 times to obtain each specimen’s biomarker value as a function of days post infection, yielding 10,000 sets of 31 standardized residuals. These standardized residuals were distributed within [−2:2], implying that the WIHS sequence dataset conformed to the GSI dynamics inferred from 438 independent specimens presented in Fig. 3A. (B) The p-value distribution of 10,000 Anderson-Darling tests. All p values were above 0.28, suggesting that the GSI distribution of the WIHS validation dataset is statistically consistent with the model estimate in Fig. 3.

References

    1. Brookmeyer R. Reconstruction and future trends of the AIDS epidemic in the United States. Science. 1991;253:37–42. doi: 10.1126/science.2063206. - DOI - PubMed
    1. Busch MP, et al. Beyond detuning: 10 years of progress and new challenges in the development and application of assays for HIV incidence estimation. AIDS. 2010;24:2763–2771. doi: 10.1097/QAD.0b013e32833f1142. - DOI - PubMed
    1. Mastro TD. Determining HIV incidence in populations: moving in the right direction. J Infect Dis. 2013;207:204–206. doi: 10.1093/infdis/jis661. - DOI - PubMed
    1. Incidence Assay Critical Path Working, G. More and better information to tackle HIV epidemics: towards improved HIV incidence assays. PLoS Med8, e1001045 (2011). - PMC - PubMed
    1. Brookmeyer R, Quinn TC. Estimation of current human immunodeficiency virus incidence rates from a cross-sectional survey using early diagnostic tests. American journal of epidemiology. 1995;141:166–172. doi: 10.1093/oxfordjournals.aje.a117404. - DOI - PubMed

Publication types

Substances