

Standardization of electroencephalography for multi-site, multi-platform and multi-investigator studies: insights from the canadian biomarker integration network in depression
- PMID: 28785082
- PMCID: PMC5547036
- DOI: 10.1038/s41598-017-07613-x
Standardization of electroencephalography for multi-site, multi-platform and multi-investigator studies: insights from the canadian biomarker integration network in depression
Abstract
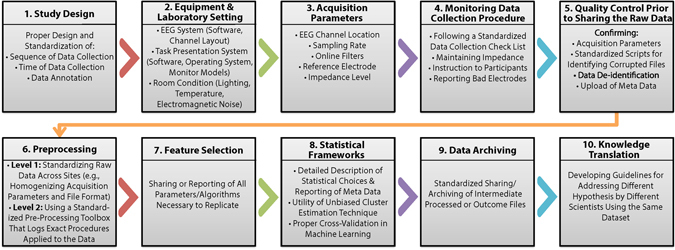
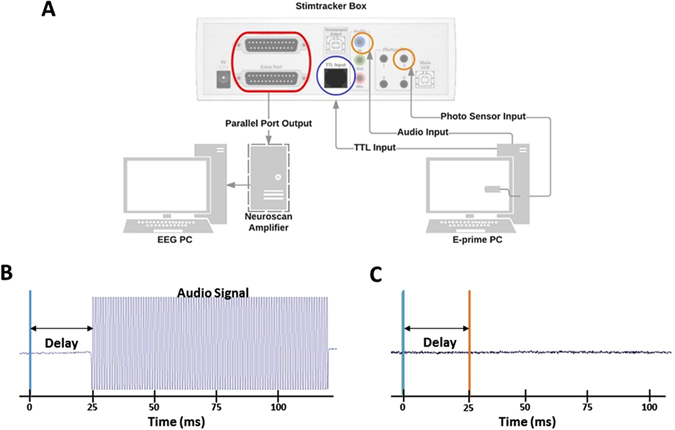
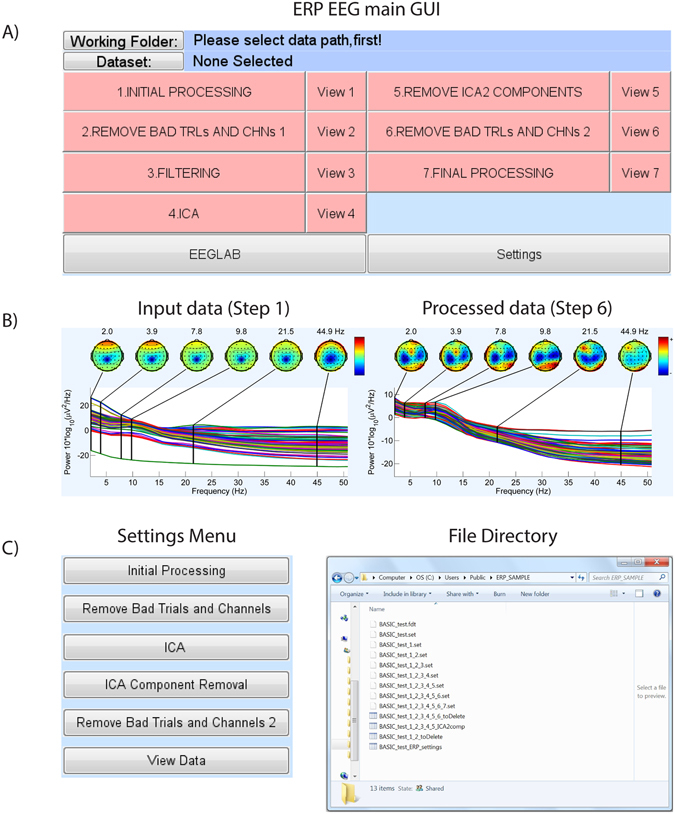
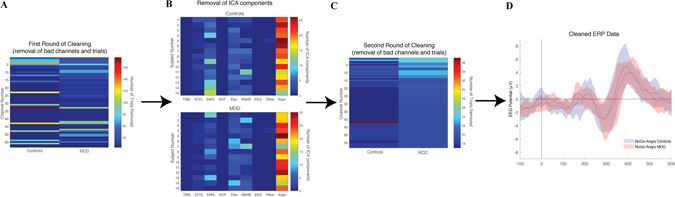
Subsequent to global initiatives in mapping the human brain and investigations of neurobiological markers for brain disorders, the number of multi-site studies involving the collection and sharing of large volumes of brain data, including electroencephalography (EEG), has been increasing. Among the complexities of conducting multi-site studies and increasing the shelf life of biological data beyond the original study are timely standardization and documentation of relevant study parameters. We present the insights gained and guidelines established within the EEG working group of the Canadian Biomarker Integration Network in Depression (CAN-BIND). CAN-BIND is a multi-site, multi-investigator, and multi-project network supported by the Ontario Brain Institute with access to Brain-CODE, an informatics platform that hosts a multitude of biological data across a growing list of brain pathologies. We describe our approaches and insights on documenting and standardizing parameters across the study design, data collection, monitoring, analysis, integration, knowledge-translation, and data archiving phases of CAN-BIND projects. We introduce a custom-built EEG toolbox to track data preprocessing with open-access for the scientific community. We also evaluate the impact of variation in equipment setup on the accuracy of acquired data. Collectively, this work is intended to inspire establishing comprehensive and standardized guidelines for multi-site studies.
Conflict of interest statement
The authors declare that they have no competing interests.
Figures
Similar articles
-
Discovering biomarkers for antidepressant response: protocol from the Canadian biomarker integration network in depression (CAN-BIND) and clinical characteristics of the first patient cohort.BMC Psychiatry. 2016 Apr 16;16:105. doi: 10.1186/s12888-016-0785-x. BMC Psychiatry. 2016. PMID: 27084692 Free PMC article.
-
TMSEEG: A MATLAB-Based Graphical User Interface for Processing Electrophysiological Signals during Transcranial Magnetic Stimulation.Front Neural Circuits. 2016 Oct 7;10:78. doi: 10.3389/fncir.2016.00078. eCollection 2016. Front Neural Circuits. 2016. PMID: 27774054 Free PMC article.
-
The comparative effectiveness of electroencephalographic indices in predicting response to escitalopram therapy in depression: A pilot study.J Affect Disord. 2018 Feb;227:542-549. doi: 10.1016/j.jad.2017.10.028. Epub 2017 Nov 3. J Affect Disord. 2018. PMID: 29169123
-
Characterizing and Modulating Brain Circuitry through Transcranial Magnetic Stimulation Combined with Electroencephalography.Front Neural Circuits. 2016 Sep 22;10:73. doi: 10.3389/fncir.2016.00073. eCollection 2016. Front Neural Circuits. 2016. PMID: 27713691 Free PMC article. Review.
-
Integrative neuroscience: the role of a standardized database.Clin EEG Neurosci. 2005 Apr;36(2):64-75. doi: 10.1177/155005940503600205. Clin EEG Neurosci. 2005. PMID: 15999901 Review.
Cited by
-
Modulation of neural oscillations in escitalopram treatment: a Canadian biomarker integration network in depression study.Transl Psychiatry. 2024 Oct 12;14(1):432. doi: 10.1038/s41398-024-03110-8. Transl Psychiatry. 2024. PMID: 39396045 Free PMC article.
-
Resting-State EEG Signal for Major Depressive Disorder Detection: A Systematic Validation on a Large and Diverse Dataset.Biosensors (Basel). 2021 Dec 6;11(12):499. doi: 10.3390/bios11120499. Biosensors (Basel). 2021. PMID: 34940256 Free PMC article.
-
A Quantitative EEG Toolbox for the MNI Neuroinformatics Ecosystem: Normative SPM of EEG Source Spectra.Front Neuroinform. 2020 Aug 7;14:33. doi: 10.3389/fninf.2020.00033. eCollection 2020. Front Neuroinform. 2020. PMID: 32848689 Free PMC article.
-
EEG Phase Can Be Predicted with Similar Accuracy across Cognitive States after Accounting for Power and Signal-to-Noise Ratio.eNeuro. 2023 Sep 5;10(9):ENEURO.0050-23.2023. doi: 10.1523/ENEURO.0050-23.2023. Print 2023 Sep. eNeuro. 2023. PMID: 37558464 Free PMC article.
-
A systematic review of mobile brain/body imaging studies using the P300 event-related potentials to investigate cognition beyond the laboratory.Cogn Affect Behav Neurosci. 2024 Aug;24(4):631-659. doi: 10.3758/s13415-024-01190-z. Epub 2024 Jun 4. Cogn Affect Behav Neurosci. 2024. PMID: 38834886
References
Publication types
MeSH terms
Substances
Grants and funding
LinkOut - more resources
Full Text Sources
Other Literature Sources
Medical
