. 2017 Jul 21:8:1256.
doi: 10.3389/fpls.2017.01256. eCollection 2017.

Episodic Canopy Structural Transformations and Biological Invasion in a Hawaiian Forest

Affiliations

Episodic Canopy Structural Transformations and Biological Invasion in a Hawaiian Forest

Christopher S Balzotti et al. Front Plant Sci. .

Abstract

The remaining native forests on the Hawaiian Islands have been recognized as threatened by changing climate, increasing insect outbreak, new deadly pathogens, and growing populations of canopy structure-altering invasive species. The objective of this study was to assess long-term, net changes to upper canopy structure in sub-montane forests on the eastern slope of Mauna Kea volcano, Hawai'i, in the context of continuing climate events, insect outbreaks, and biological invasion. We used high-resolution multi-temporal Light Detection and Ranging (LiDAR) data to quantify near-decadal net changes in forest canopy height and gap distributions at a critical transition between alien invaded lowland and native sub-montane forest at the end of a recent drought and host-specific insect (Scotorythra paludicola) outbreak. We found that sub-montane forests have experienced a net loss in average canopy height, and therefore structure and aboveground carbon stock. Additionally, where invasive alien tree species co-dominate with native trees, the upper canopy structure became more homogeneous. Tracking the loss of forest canopy height and spatial variation with airborne LiDAR is a cost-effective way to monitor forest canopy health, and to track and quantify ecological impacts of invasive species through space and time.

Keywords: carnegie airborne observatory; forest change; forest gaps; invasive species; lidar; remote sensing.


Figures

FIGURE 1
FIGURE 1
Change in top-of-canopy height (TCH) in forests of the Laupāhoehoe study region (600–1100 m a.s.l.), located on the eastern slope of Mauna Kea volcano, Hawai‘i island (155°15′54.63″W, 19°56′11.13″N). The black outline is the extent of the Laupāhoehoe forest reserve. Areas in red represent the greatest amount of canopy height loss between 2007 and 2016. The lower forests outlined in white (600–700 m a.s.l.) are dominated by invasive tree species that were established well before 2007(established-invasion). Forests outlined in brown (800–900 m a.s.l.) are in the process of invasion by alien tree species (invasion-outbreak), and the native trees have experienced a defoliation event from a koa moth (Scotorythra paludicola) outbreak in 2013. Upper forests in pink (900–1000 m a.s.l.) are native with minimal presence of alien tree species (native-outbreak); however, they were also heavily defoliated by the 2013 koa moth outbreak.
FIGURE 2
FIGURE 2
Example results on changes in top-of-canopy height (TCH) and gaps, derived from airborne LiDAR. (A) TCH in 2007. (B) TCH in 2016. (C) Change in TCH between 2007 and 2016. (D) Gap dynamics from 2007 to 2016, showing newly formed gaps in red, filled gaps in green, and gaps that have persisted from before 2007 in brown.
FIGURE 3
FIGURE 3
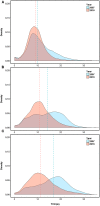
Top-of-canopy height (TCH) distribution on the eastern slope of Mouna Kea volcano, Hawaii (155°15′54.63″W, 19°56′11.13″N) for (A) established tree invasion area dominated by alien Psidium cattleianum and Ficus rubiginosa (established-invasion) (B) tree invasion plus koa moth (Scotorythra paludicola) outbreak (invasion-outbreak). (C) Koa moth outbreak with minimal tree invasion (native-outbreak). Median values for each year are represented with dashed lines, with 2007 in blue and 2016 in red.
FIGURE 4
FIGURE 4
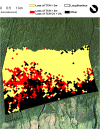
Map highlighting the transition zone (red) between highly invaded and native dominated forests, based on top-of-canopy height (TCH), decreasing and becoming less complex. Forests on a per hectare basis that have experienced a net loss in median TCH > 3 m (yellow) and a minimum decrease in TCH variation of 2% (red) from 2007 to 2016. Black areas did not experience a decrease in median TCH > 3 m.
FIGURE 5
FIGURE 5
Net change in top-of-canopy height (TCH) between 2007 and 2016. Different letters below the x-axis indicate statistically significant differences between forest types (Table 1).
FIGURE 6
FIGURE 6
Change in gap dynamics between 2007 and 2016. Different letters below the x-axis indicate statistically significant differences between forest types (Table 1).

References

    1. Allen C. D., Macalady A. K., Chenchouni H., Bachelet D., McDowell N., Vennetier M., et al. (2010). A global overview of drought and heat-induced tree mortality reveals emerging climate change risks for forests. For. Ecol. Manage. 259 660–684. 10.1016/j.foreco.2009.09.001 - DOI
    1. Allison S. D., Vitousek P. M. (2004). Rapid nutrient cycling in leaf litter from invasive plants in Hawai’i. Oecologia 141 612–619. 10.1007/s00442-004-1679-z - DOI - PubMed
    1. Anderegg W. R. L., Kane J. M., Anderegg L. D. L. (2013). Consequences of widespread tree mortality triggered by drought and temperature stress. Nat. Clim. Chang 3 30–36. 10.1038/nclimate1635 - DOI
    1. Asner G. P., Flint Hughes R., Varga T. A., Varga T. A., Knapp D. E., Bowdoin T. K. (2009). Environmental and biotic controls over aboveground biomass throughout a tropical rain forest. Ecosystems 12 261–278. 10.1007/s10021-008-9221-5 - DOI
    1. Asner G. P., Hughes R. F., Vitousek P. M., Knapp D. E., Kennedy-Bowdoin T., Boardman J., et al. (2008). Invasive plants transform the three-dimensional structure of rain forests. Proc. Natl. Acad. Sci. U.S.A. 105 4519–4523. 10.1073/pnas.0710811105 - DOI - PMC - PubMed

LinkOut - more resources