. 2017 Jul 25;4(4):ENEURO.0146-17.2017.
doi: 10.1523/ENEURO.0146-17.2017. eCollection 2017 Jul-Aug.

Action Potential Dynamics in Fine Axons Probed with an Axonally Targeted Optical Voltage Sensor

Affiliations

Action Potential Dynamics in Fine Axons Probed with an Axonally Targeted Optical Voltage Sensor

Yihe Ma et al. eNeuro. .

Abstract

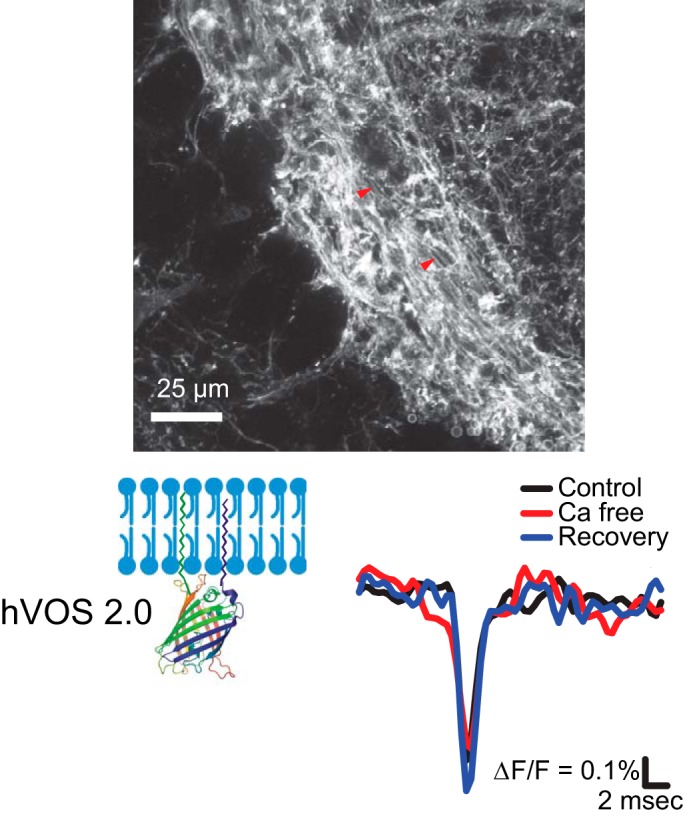
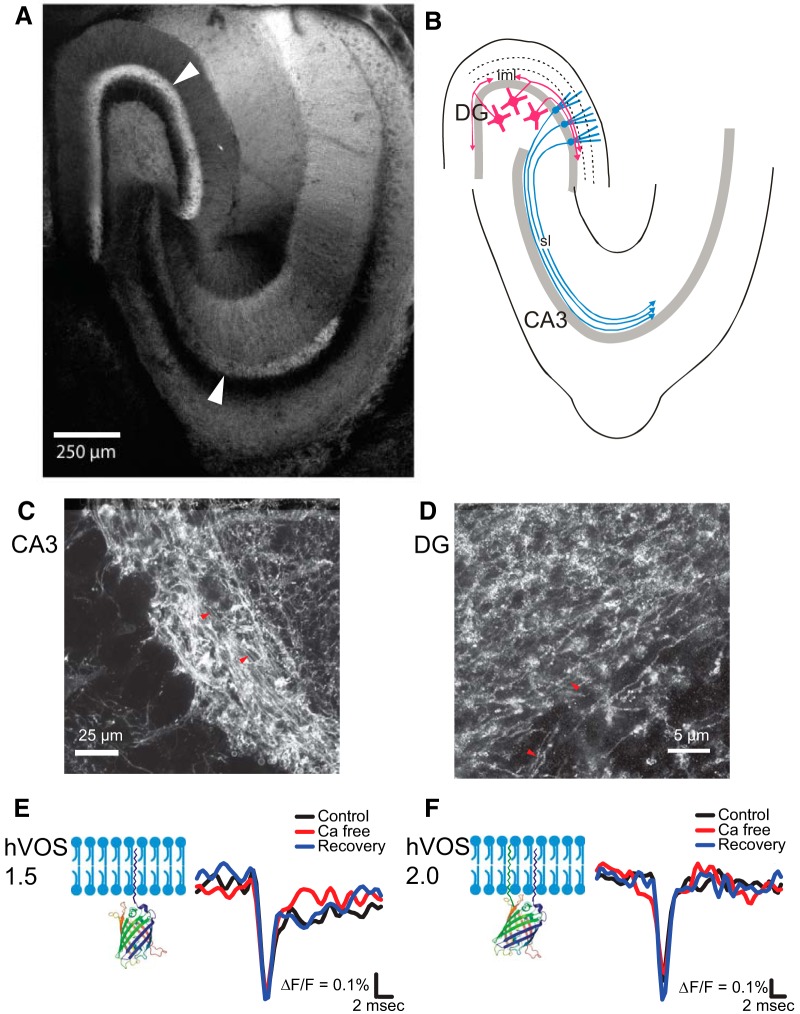
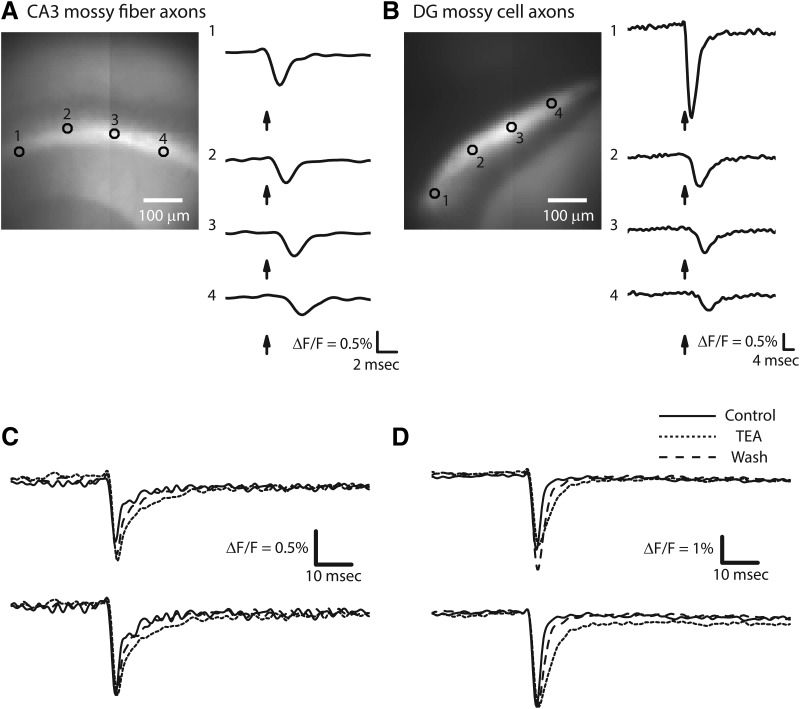
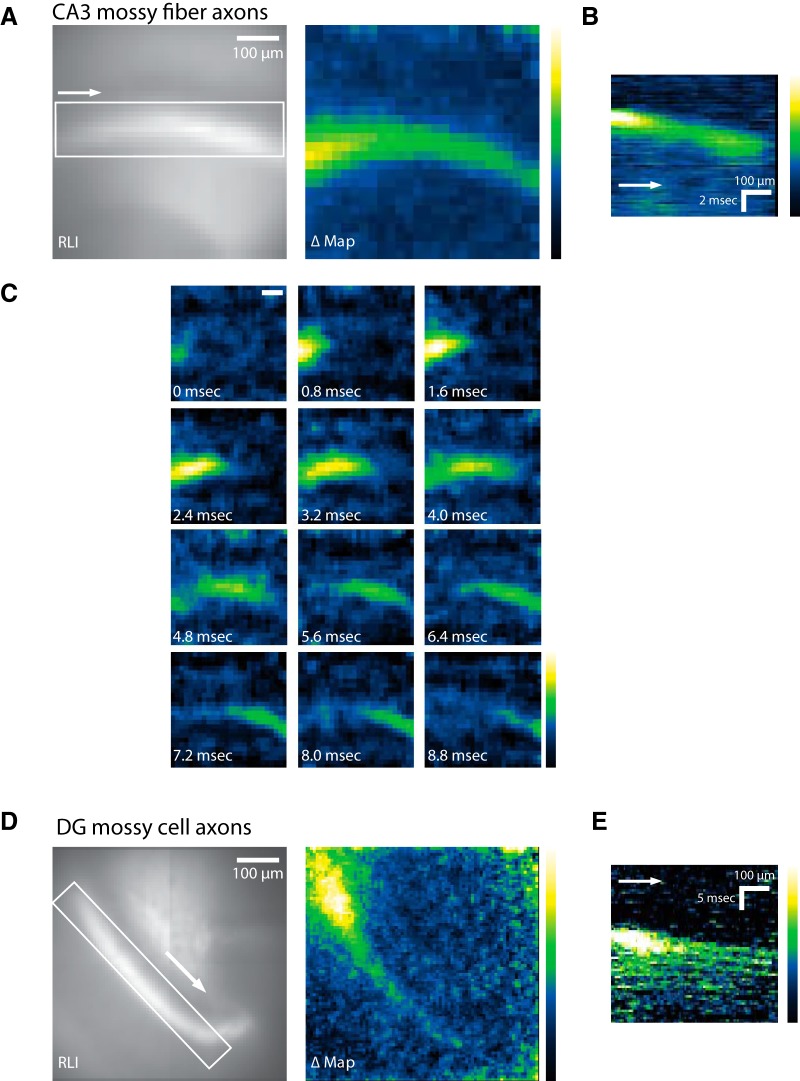
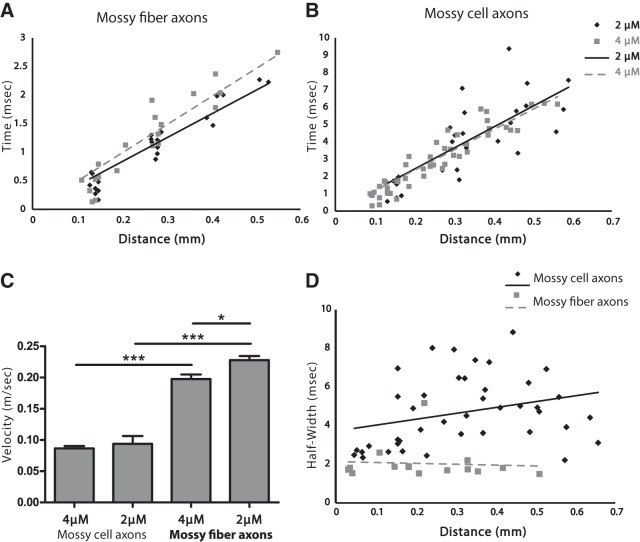
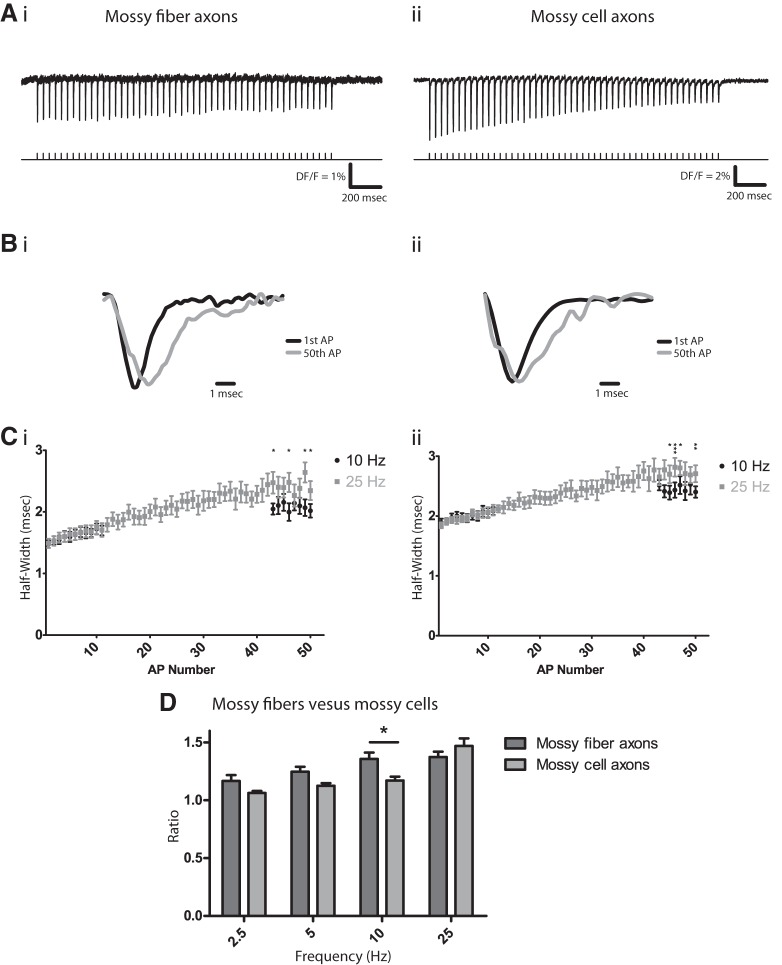
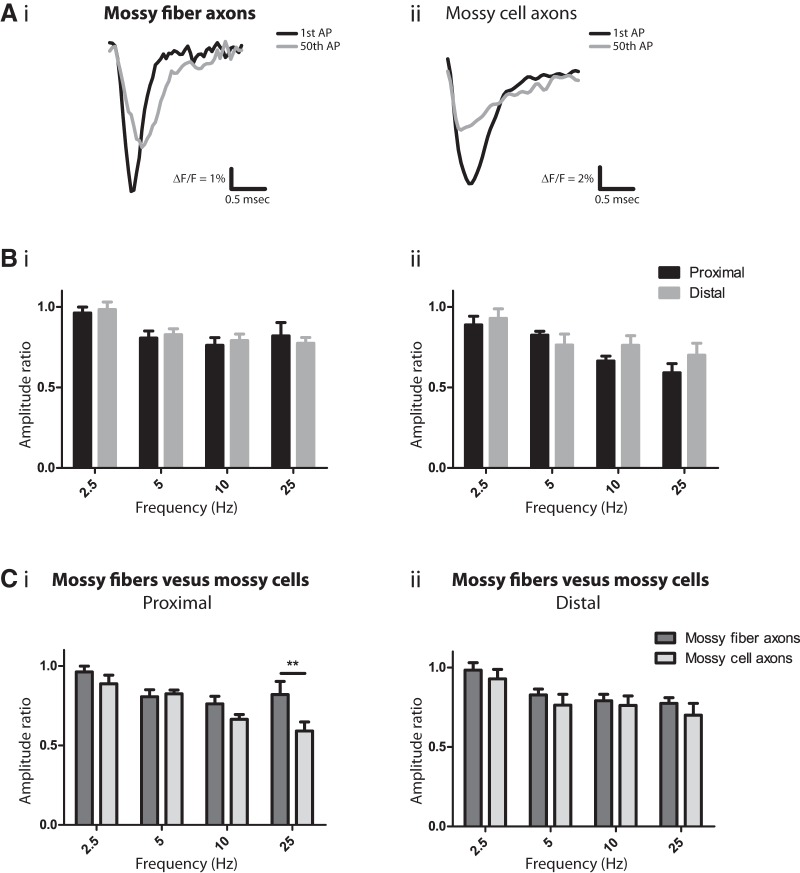
The complex and malleable conduction properties of axons determine how action potentials propagate through extensive axonal arbors to reach synaptic terminals. The excitability of axonal membranes plays a major role in neural circuit function, but because most axons are too thin for conventional electrical recording, their properties remain largely unexplored. To overcome this obstacle, we used a genetically encoded hybrid voltage sensor (hVOS) harboring an axonal targeting motif. Expressing this probe in transgenic mice enabled us to monitor voltage changes optically in two populations of axons in hippocampal slices, the large axons of dentate granule cells (mossy fibers) in the stratum lucidum of the CA3 region and the much finer axons of hilar mossy cells in the inner molecular layer of the dentate gyrus. Action potentials propagated with distinct velocities in each type of axon. Repetitive firing broadened action potentials in both populations, but at an intermediate frequency the degree of broadening differed. Repetitive firing also attenuated action potential amplitudes in both mossy cell and granule cell axons. These results indicate that the features of use-dependent action potential broadening, and possible failure, observed previously in large nerve terminals also appear in much finer unmyelinated axons. Subtle differences in the frequency dependences could influence the propagation of activity through different pathways to excite different populations of neurons. The axonally targeted hVOS probe used here opens up the diverse repertoire of neuronal processes to detailed biophysical study.

Keywords: Axonal membranes; excitability; fluorescence imaging; voltage imaging.


Conflict of interest statement

Authors report no conflict of interest.

Figures

None
Graphical abstract
Figure 1.
Figure 1.
hVOS probe expression in axons. A, Two-photon image of a hippocampal slice from a thy1-hVOS 2.0 transgenic mouse at low magnification shows the pattern of probe expression. Note the strong probe expression in the iml of the dentate gyrus (DG) and mossy fibers in the sl of the CA3 region (arrowheads). B, Diagram illustrating the labeled axons in A based on known hippocampus anatomy. Axons of hilar mossy cells (magenta) are located in the iml; the sl contains axons of dentate granule cells (cyan). C, At higher magnification, two-photon microscopy reveals mossy fiber axons (marked by red arrowheads) in the sl. D, STED microscopy reveals probe-expressing mossy cell axons (marked by red arrowheads) in the iml. E, hVOS 1.5 tethered by a C-terminal h-ras motif to the plasma membrane is illustrated on the left. In the sl, this probe registered a spike-like axonal AP followed by a synaptic response. Black, control aCSF; red, aCSF without calcium; blue, after return to control aCSF with calcium. Calcium removal reversibly blocked the later synaptic component but left the AP unchanged. F, hVOS 2.0 has the same C-terminal membrane linkage as in hVOS 1.5, as well as an N-terminal link derived from GAP-43 (both termini are on the same side of the beta-barrel). hVOS 2.0 registered only an axonal AP with no late synaptic component. The AP was unaffected by calcium removal in both hVOS 1.5 and hVOS 2.0 recordings. Stimulus = 200 µA; [DPA] = 4 µM. 10-trial averages.
Figure 2.
Figure 2.
Imaging APs in a hippocampal slice from a thy1-hVOS 2.0 mouse. A, Probe fluorescence in mossy fiber axons in the sl originating from dentate granule cells. Image shows the CA3 region (see Fig. 1A) with selected locations numbered in the sl. The stimulating electrode is in the sl to the left of location 1. On the right are hVOS traces (10-trial averages) from the indicated locations; arrows indicate time of stimulation. The latency increased with distance from the stimulus electrode. Stimulus = 200 µA; [DPA] = 4 µM. B, Probe fluorescence in mossy cell axons in the iml. The bright iml is flanked by the darker stratum granulosum below and middle molecular layer above. The stimulating electrode is just outside the field of view from the lower left corner. Numbered locations are indicated in the iml, and traces to the right show 10-trial averages from those locations. Note the longer time scale in B compared with A due to slower propagation in mossy cell axons compared with mossy fibers. Traces in A and B were normalized. Stimulus = 200 µA; [DPA] = 4 µM. C, AP broadening by 10 mM TEA in CA3 mossy fibers. D, AP broadening by 10 mM TEA in mossy cell axons. Solid, control trace; dotted, in TEA; dashed, after TEA washout. TEA reversibly broadened APs by slowing repolarization. Upper traces were not normalized; lower traces were normalized to peak amplitude. Stimulus = 75 µA (C) and 100 µA (D). [DPA] = 2 µM. 10-trial averages.
Figure 3.
Figure 3.
Spatiotemporal dynamics of hVOS signals. A, In the CA3 region of a hippocampal slice, images of probe fluorescence [resting light intensity (RLI), left] and maximal stimulus-evoked fluorescence change (ΔMap, right) illustrate the distribution of probe and voltage response, respectively. The response map was created by subtracting the mean baseline fluorescence intensity from the maximal response to generate ΔF/F. Responses were inverted to make ΔF/F positive and aid in visualization. B, Spatiotemporal map showing spread of activity in the region of interest (white rectangle) in the RLI image in A (left). Fluorescence (averaged along the y-axis for each x value) was plotted versus time to show the spread of activity. The arrow indicates orientation with respect to the RLI image. C, A sequence of response intensity snapshots at 0.8-ms intervals illustrates the spread of activity in the sl along CA3 mossy fibers (from A). Scale bar = 100 µm. D, RLI and ΔMap (as in A) from a region in the iml in the dentate gyrus. E, Spatiotemporal map (as in B) of signal spread along the iml. Fluorescence was averaged along the short axis of the region of interest in D. The arrow indicates orientation with respect to the RLI image in D.
Figure 4.
Figure 4.
AP propagation velocity. Plots of time to half peak versus distance illustrate propagation in mossy fibers (A) and mossy cell axons (B) in 2 µM (diamonds, solid line) and 4 µM (squares, dashed line) DPA. Linearity indicates propagation with a constant velocity (R 2 = 0.902 and 0.859 in A; R 2 = 0.607 and 0.870 in B), and linear regression gives the velocity as the reciprocal of the slope. C, Mean conduction velocities from the indicated conditions. AP conduction was faster in mossy fibers. Conduction was slightly slower in 4 µM DPA than in 2 µM; the difference was significant only in CA3 mossy fibers (p = 0.018; n = 15 and 10, respectively) but not in mossy cell axons (p = 0.59; n = 7 in both). *, p < 0.05; ***, p < 0.001. D, AP half-width was correlated with propagation distance in mossy cell axons (diamonds, Spearman r = 0.3557, p = 0.0225; solid line, linear fit of the data shows a positive slope = 3.03 ms/mm), suggesting nonuniform propagation velocity. In mossy fibers (squares) there was no significant correlation between half-width and propagation distance (Spearman r = –0.2393, p = 0.3904; dashed line, linear fit of the data), suggesting more uniform conduction velocity.
Figure 5.
Figure 5.
Activity-dependent AP broadening. A, APs elicited by a 25-Hz train of 50 pulses in mossy fibers (i) and mossy cell axons (ii). B, Superimposed normalized traces of the first (black) and 50th (gray) AP from A show that the final AP is broader, with a slower decay in both mossy fibers (i) and mossy cell axons (ii). Traces are normalized to their peak amplitude. C, Half-width versus spike number at 10 Hz (black) and 25 Hz (gray) in mossy fibers (i) and mossy cell axons (ii; note that the points from the two frequencies overlie one another for the first 10 spikes). n = 13 and 11 for mossy fibers; n = 10 and 10 for mossy cell axons, where n is number of slices. D, Frequency-dependent AP broadening differed between mossy fibers (dark gray) and mossy cell axons (light gray). AP broadening was assessed by dividing the mean half-width of the last two APs in a train of 50 by the mean half-width of the first two APs. Two-way ANOVA indicated that both frequency (p = 0.027) and region (sl and iml; p < 0.0001) contribute to the variation in broadening ratio. The interaction between frequency and region was also significant (p = 0.016). p = 0.32, 0.084, 0.0084, and 0.12 (in order of increasing frequency) for the post hoc tests, compared with p = 0.0125 with the Bonferroni correction. n = 11, 16, 13, 20 slices for mossy fibers; n = 9, 10, 12, 13 slices for mossy cell axons (increasing frequency). Stimulus = 100 µA; [DPA] = 2 µM. *, p < 0.05; **, p < 0.01; ***, p < 0.001.
Figure 6.
Figure 6.
Activity-dependent AP attenuation. A, Superimposed recordings (not normalized) of the first (black) and last (gray) AP from a 25-Hz train of 50 spikes from mossy fibers (i) and mossy cell axons (ii) showed that the final APs were smaller. B, AP amplitudes decline in mossy fibers (i) and mossy cell axons (ii) assessed by amplitude ratio near the stimulation site (proximal; black) and ∼300 µm away (distal; gray). Ratios were calculated as the average amplitude of the last two APs divided by the average amplitude of the first two APs. Amplitude decreased during repetitive firing, and this decrease was greater at higher frequencies (two-way ANOVA, p = 0.0062 for mossy fibers and 0.0008 for mossy cell axons). The changes at proximal and distal sites were statistically indistinguishable (p = 0.80 in mossy fibers; 0.20 in mossy cells). C, Comparisons of frequency-dependent amplitude decrease between mossy fibers (dark gray) and mossy cell axons (light gray) at proximal (i) and distal sites (ii). Two-way ANOVA indicated that near the stimulation site, both axon type and frequency contributed to use-dependent decreases (p = 0.0069 and p < 0.0001, respectively). p = 0.26, 0.76, 0.18, and 0.0020 (in order of increasing frequency) for the post hoc tests, compared with p = 0.0125 and 0.0025 with the Bonferroni correction (**, p < 0.01). At distal sites, however, the decreases were similar in the two axon types (p = 0.19). n = 9, 11, 7, 7 for CA3 mossy fibers and n = 11, 12, 9, 11 for mossy cell axons (increasing frequency). Stimulus = 100 µA; [DPA] = 2 µM.

References

    1. Aldrich RW, Getting PA, Thompson SH (1979) Mechanism of frequency-dependent broadening of molluscan neurone soma spikes. J Physiol 291:531–544. - PMC - PubMed
    1. Alle H, Kubota H, Geiger JRP (2011) Sparse but highly efficient Kv3 outpace BKCa channels in action potential repolarization at hippocampal mossy fiber boutons. J Neurosci 31:8001–8012. 10.1523/JNEUROSCI.0972-11.2011 - DOI - PMC - PubMed
    1. Amaral DG, Scharfman HE, Lavenex P (2007) The dentate gyrus: fundamental neuroanatomical organization (dentate gyrus for dummies). Prog Brain Res 163:3–22. 10.1016/S0079-6123(07)63001-5 - DOI - PMC - PubMed
    1. Augustine GJ (1990) Regulation of transmitter release at the squid giant synapse by presynaptic delayed rectifier potassium current. J Physiol 431:343–364. - PMC - PubMed
    1. Bean BP (2007) The action potential in mammalian central neurons. Nat Rev Neurosci 8:451–465. 10.1038/nrn2148 - DOI - PubMed

Publication types

LinkOut - more resources