. 2017 Dec;469(12):1631-1649.
doi: 10.1007/s00424-017-2037-4. Epub 2017 Aug 7.

Effect of temperature on FAD and NADH-derived signals and neurometabolic coupling in the mouse auditory and motor cortex

Affiliations

Effect of temperature on FAD and NADH-derived signals and neurometabolic coupling in the mouse auditory and motor cortex

Baher A Ibrahim et al. Pflugers Arch. 2017 Dec.

Abstract

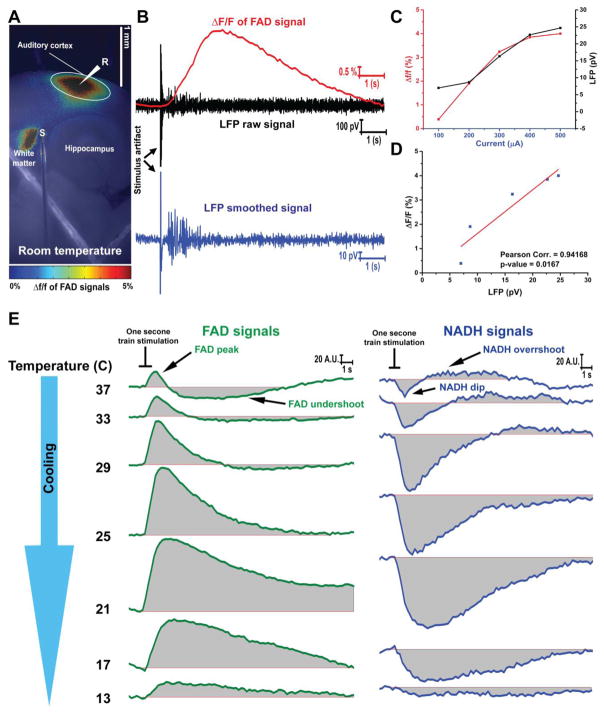
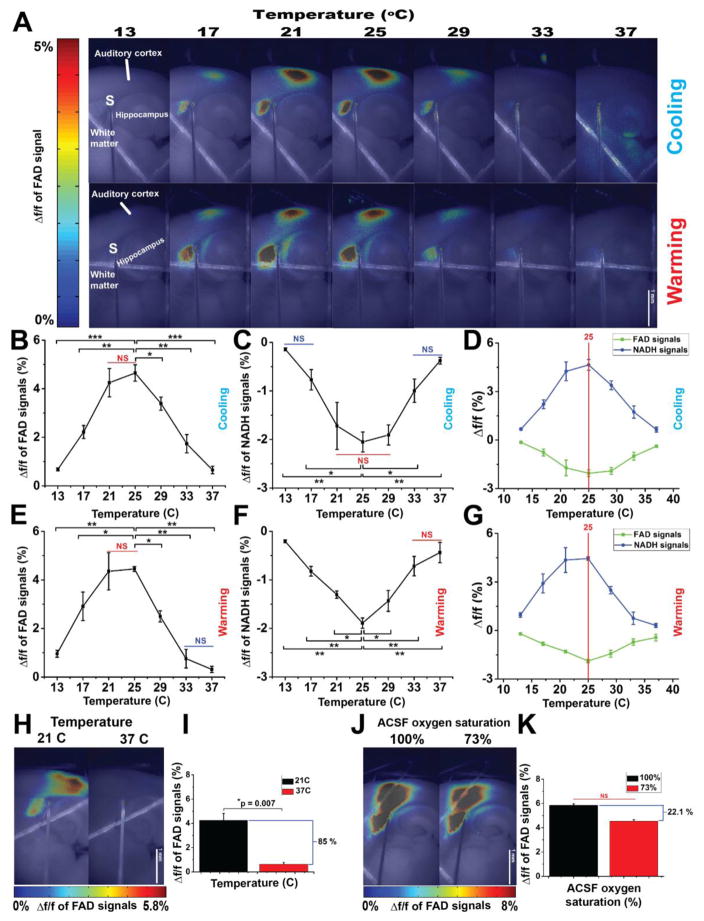
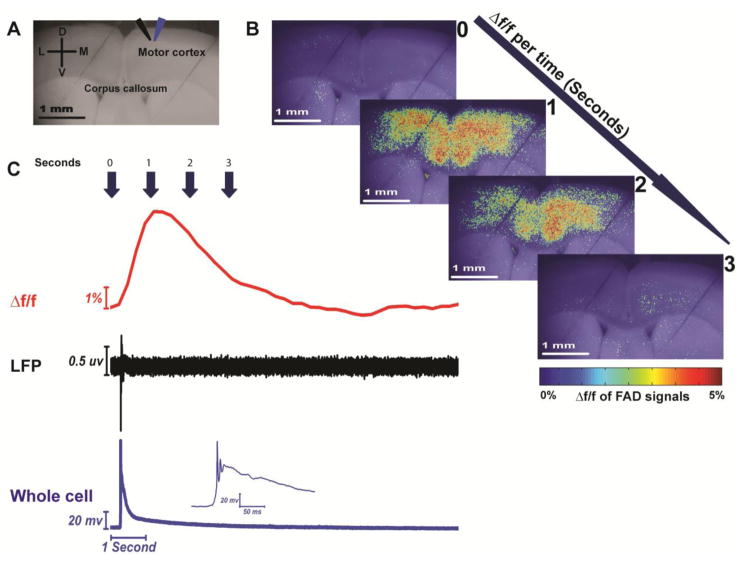
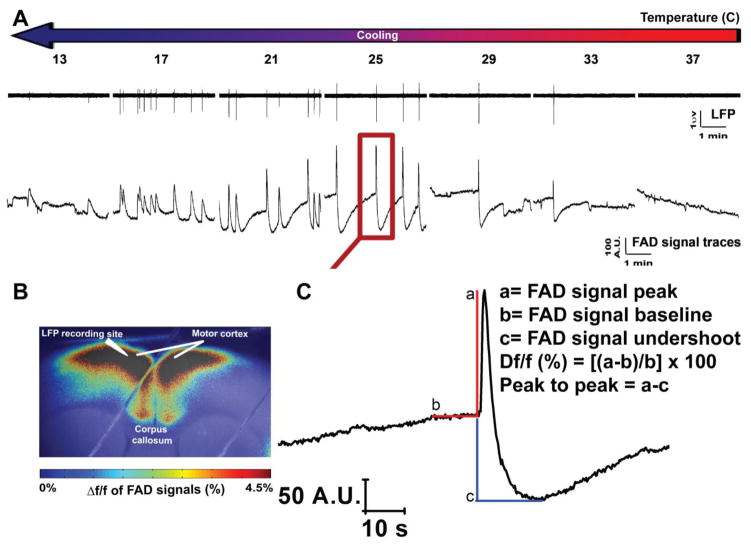
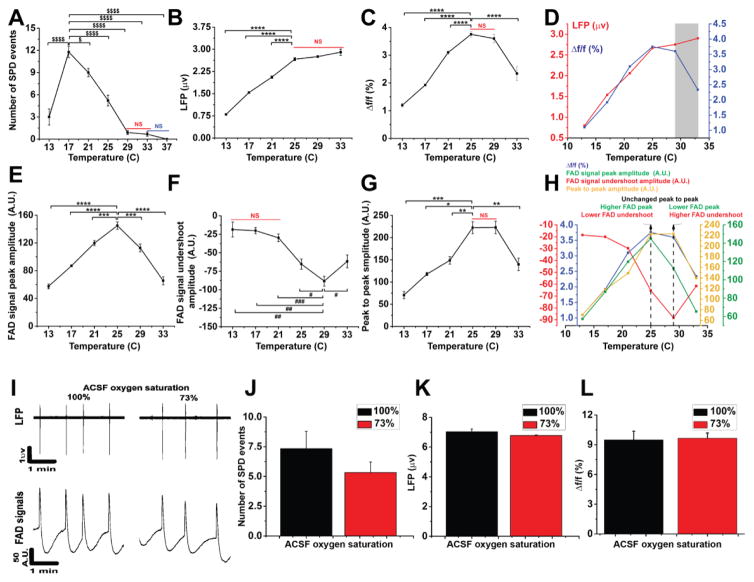
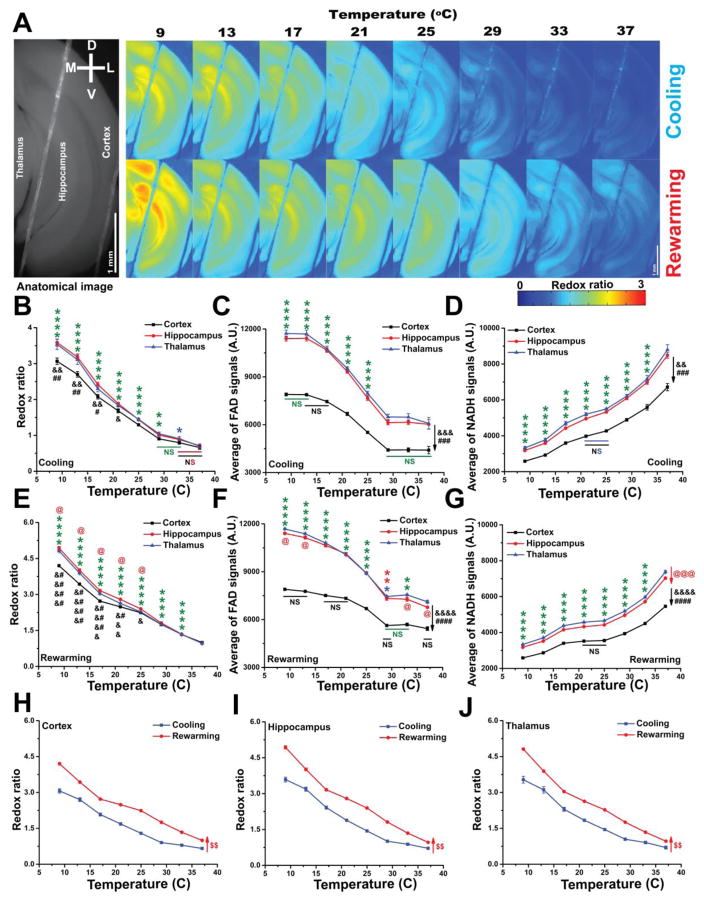
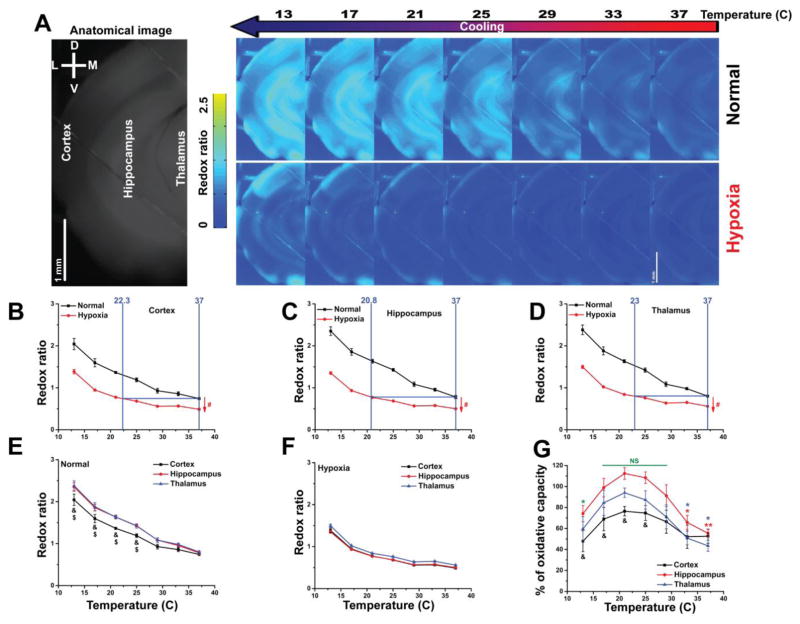
Tight coupling of neuronal metabolism to synaptic activity is critical to ensure that the supply of metabolic substrates meets the demands of neuronal signaling. Given the impact of temperature on metabolism, and the wide fluctuations of brain temperature observed during clinical hypothermia, we examined the effect of temperature on neurometabolic coupling. Intrinsic fluorescence signals of the oxidized form of flavin adenine dinucleotide (FAD) and the reduced form of nicotinamide adenine dinucleotide (NADH), and their ratios, were measured to assess neural metabolic state and local field potentials were recorded to measure synaptic activity in the mouse brain. Brain slice preparations were used to remove the potential impacts of blood flow. Tight coupling between metabolic signals and local field potential amplitudes was observed at a range of temperatures below 29 °C. However, above 29 °C, the metabolic and synaptic signatures diverged such that FAD signals were diminished, but local field potentials retained their amplitude. It was also observed that the declines in the FAD signals seen at high temperatures (and hence the decoupling between synaptic and metabolic events) are driven by low FAD availability at high temperatures. These data suggest that neurometabolic coupling, thought to be critical for ensuring the metabolic health of the brain, may show temperature dependence, and is related to temperature-dependent changes in FAD supplies.

Keywords: Auditory cortex; Flavoprotein imaging; Hippocampus; Hypothermia; Neurometabolic coupling; Temperature.


Conflict of interest statement

Disclosure/Conflict of Interest:

The authors have no conflicts of interest to disclose.

Figures

Figure 1
Figure 1. FAD and NADH signals associated with the electric stimulation of white matter at 25°C
A) Pseudocolor heat map of the average intensity of the Δf/f of FAD signals evoked by the electrical stimulation of subcortical white matter of auditory thalamocortical brain slice at room temperature; S: the stimulation site, R, LFP recording site, White circle: The region of interest (ROI) used to quantify Δf/f of FAD signals; B) Time traces of FAD (top panel, green), LFP raw (middle panel, red), and LFP smoothed (bottom panel, blue) signals of the auditory cortex after electrical stimulation of subcortical white matter at room temperature; C) Merged plots of LFP and Δf/f of FAD signals with increasing current; D) Pearson correlation plot between LFP and Δf/f of FAD signals; E) The change of raw FAD (right panel, green lines) and NADH (left panel, blue lines) signals of the auditory cortex at different temperatures after electrical stimulation of subcortical white matter, black lines: the duration of the electrical train (1 second).
Figure 2
Figure 2. The metabolic signals associated with synaptic activity is a temperature-dependent
A) Pseudocolor heat map of the average intensity of the Δf/f of FAD signals evoked by the electrical stimulation of subcortical white matter of auditory thalamocortical brain slice at different temperatures under cooling (top panel) and warming (bottom panel); S: Site of stimulating electrode; B and E) Line plots between temperature (x-axis) and Δf/f of FAD signals associated with synaptic activity (y-axis) under cooling and warming, respectively; C and F) Line plots between temperature (x-axis) and Δf/f of NADH signals associated with synaptic activity (y-axis) under cooling and warming, respectively, D and G) Merged plots of Δf/f of both FAD and NADH under cooling and warming, respectively, red line shows the maximum values of Δf/f of both signals; H and J) Pseudocolor heat map of the average intensity of the Δf/f of FAD signals associated with synaptic activity at (21 vs. 37°C) and at (100 vs. 73%) oxygen saturated ACSF, respectively; I) Bar plots of Δf/f of FAD signals associated with synaptic activity at 21°C (black bar) vs 37°C (red bar); K) Bar plots of Δf/f of FAD signals associated with synaptic activity under 100% (black bar) vs 73% (red bar) oxygen saturated ACSF at 21°C; N = 4 (one slice per mouse); Post hoc, *vs 25°C (0.05>p>1×10⁻⁴), **vs 25°C (1×10⁻⁴>p>1×10⁻⁷), ***vs 25°C (1×10⁻⁷>p>1×10⁻⁹); NS: non-significant difference between temperatures covered with a solid line.
Figure 3
Figure 3. Simultaneous flavoprotein imaging and electrophysiological recording of the spontaneous paroxysmal depolarizing (SPD) events evoked by SR-95531
A) Grayscale image of coronal brain slice showing the site of LFP (black arrow) and whole-cell recording (blue arrow); B) Pseudocolor heat maps of coronal brain slice showing the change of Δf/f of FAD signals associated with SPD events per time; C) Time traces of Δf/f of FAD (top panel), LFP (middle panel), and whole cell recording (bottom panel) signals of SPD events occurring in the presence of 4 μM SR-95531.
Figure 4
Figure 4. Simultaneous measurement of LFP and FAD signals of SPD events occurring in the presence SR-95531 at different temperatures
A) Time traces of LFP (top panel) and those of FAD (bottom panel) signals associated with the SPD events in cortical layer 2/3 occurring in the presence of 4 μM of SR-95531 at different temperatures; B) Pseudocolor heat map of the average intensity of the Δf/f of FAD signals associated with SPD events; C) Expansion of one FAD signal from FAD trace at 25°C on panel A (red square) giving an expanded view for the different quantified components of FAD signal used for the analysis.
Figure 5
Figure 5. Neurometabolic coupling is a temperature dependent
A–C, E–G) Line plots showing temperature (x-axis) and the number of SPD events, LFP amplitudes, Δf/f of FAD signals associated with SPD events, FAD signal peaks, FAD signal undershoots, peak to peak of FAD signals, respectively, (y-axis); D) Merged plots of LFP and Δf/f of FAD signals with temperature, gray box indicates decoupling zone; H) Merged plots of FAD signal components with temperature, dotted black line shows the maximum values of both FAD signal components; I) Time traces of LFP (top panel) and FAD (bottom panel) signals associated with SPD events recorded under 100% versus 73% oxygen saturated ACSF; J–L) Bar plots of the number of SPD events, LFP amplitude, and Δf/f of FAD signals associated with SPD events, respectively, under 100% (black bar) vs 73% (red bar) oxygen saturated ACSF; (For LFP and Δf/f, N = 9, n = 352 and 322, respectively; for FAD signal peak, undershoot, and peak to peak, N = 6, n = 199, 67, 67, respectively; For LFP and Δf/f in oxygen control experiment, N = 3, n = 36 and 34, respectively, in all cases one slice was used per mouse; Post hoc, *vs 25°C (0.05>p>1×10⁻⁴), **vs 25°C (1×10⁻⁴>p>1×10⁻⁷), ***vs 25°C (1×10⁻⁷>p>1×10⁻⁹), ****vs 25°C (p<1×10⁻⁹), #vs 29°C (0.05>p>1×10⁻⁴), ##vs 29°C (1×10⁻⁴>p>1×10⁻⁷), ###vs 29°C (1×10⁻⁷>p>1×10⁻⁹); $vs 17°C (0.05>p>1×10⁻⁴), $$$$vs 17°C (p<1×10⁻⁹); NS: non-significant difference between temperatures covered with a solid line.
Figure 6
Figure 6. Only driven by FAD signals, the metabolic redox ratio of the tissue is a temperature-dependent
A) Pseudocolor heatmaps of a coronal brain slice showing the negative relationship between temperature and the redox ratio under cooling (top panel) or rewarming (bottom panel); B–D) Line plots between temperature (x-axis) and redox ratio, FAD, and NADH signals, respectively, (y-axis) of different brain structures under cooling; E–G) Line plots between temperature (x-axis) and redox ratio, FAD, and NADH signals, respectively, (y-axis) of different brain structures under rewarming; H–J) Merged plots of the redox ratios of cortex, hippocampus, and thalamus, respectively, under cooling vs rewarming with temperature; N = 4, Post hoc, *vs 37°C (0.05>p>1×10⁻⁴), **vs 37°C (1×10⁻⁴>p>1×10⁻⁷), ****vs 37°C (p<1×10⁻⁹), #Thalamus vs cortex (0.05>p>1×10⁻⁴), ##Thalamus vs cortex (1×10⁻⁴>p>1×10⁻⁷), ###Thalamus vs cortex (1×10⁻⁷>p>1×10⁻⁹), ####Thalamus vs cortex (p<1×10⁻⁹), &Hippocampus vs cortex (0.05>p>1×10⁻⁴), &&Hippocampus vs cortex (1×10⁻⁴>p>1×10⁻⁷), &&&Hippocampus vs cortex (1×10⁻⁷>p>1×10⁻⁹), &&&&Hippocampus vs cortex (p<1×10⁻⁹), @Hippocampus vs thalamus (0.05>p>1×10⁻⁴), @@@Hippocampus vs thalamus (1×10⁻⁷>p>1×10⁻⁹), $$vs cooling (1×10⁻⁴>p>1×10⁻⁷), $$$vs cooling (1×10⁻⁷>p>1×10⁻⁹); NS: non-significant difference between temperatures covered with a solid line. Statistical characters were colored black for cortex, red for hippocampus or rewarming, and green for all brain structures.
Figure 7
Figure 7. Hypothermia normalizes the oxidative states of the brain slice under hypoxia
A) Pseudocolor heatmaps of a coronal brain slice showing the change of the redox ratio of the tissue under hypoxia (bottom panel) versus normal condition (top of panel); B–D) Merged plots of the redox ratios of cortex, hippocampus, and thalamus, respectively, under normal vs hypoxia with temperature; The quantification of redox ratios of the three brain structures under hypoxia. E) Line plots between temperature (x-axis) and redox ratio (y-axis) of different brain structures under normal condition; F) Line plots between temperature (x-axis) and redox ratio (y-axis) of different brain structures under hypoxia; G) Line plots between temperature (x-axis) and % of oxidative capacity of different brain structures; N = 3; Post hoc, *vs 25°C (0.05>p>1×10⁻⁴), **vs 25°C (1×10⁻⁴>p>1×10⁻⁷), #vs Normal (0.05>p>1×10⁻⁴), $Thalamus vs cortex (0.05>p>1×10⁻⁴), &Hippocampus vs cortex (0.05>p>1×10⁻⁴), NS: non-significant difference between temperatures covered with a solid line. Statistical characters were colored black for cortex, red for hippocampus or hypoxia, blue for thalamus and green for all brain structures.

Similar articles

Cited by

References

    1. Kowalska AMG, Szego D, Pineda AL, Ayala D, Xu Yuan, Hughes N, Tito A, Jabłonska J. THE THERMAL SCANNING FLUORESCENCE STUDY ON THE CONFORMATIONAL STABILITY OF GLUCOSE OXIDASE (GOD) FROM ASPERGILLUS NIGER. Food Chemistry and Biotechnology. 2007;71:35–48.
    1. Aihara H, Okada Y, Tamaki N. The effects of cooling and rewarming on the neuronal activity of pyramidal neurons in guinea pig hippocampal slices. Brain Res. 2001;893:36–45. - PubMed
    1. Al-Juboori SI, Dondzillo A, Stubblefield EA, Felsen G, Lei TC, Klug A. Light scattering properties vary across different regions of the adult mouse brain. PLoS One. 2013;8:e67626. doi: 10.1371/journal.pone.0067626. PONE-D-13-08046 [pii] - DOI - PMC - PubMed
    1. Alva N, Palomeque J, Carbonell T. Oxidative stress and antioxidant activity in hypothermia and rewarming: can RONS modulate the beneficial effects of therapeutic hypothermia? Oxid Med Cell Longev. 2013;2013:957054. doi: 10.1155/2013/957054. - DOI - PMC - PubMed
    1. Belanger M, Allaman I, Magistretti PJ. Brain energy metabolism: focus on astrocyte-neuron metabolic cooperation. Cell Metab. 2011;14:724–738. doi: 10.1016/j.cmet.2011.08.016. S1550-4131(11)00420-7 [pii] - DOI - PubMed

LinkOut - more resources