. 2017 Sep 25;57(9):2203-2221.
doi: 10.1021/acs.jcim.7b00347. Epub 2017 Aug 24.

Statistical Analysis on the Performance of Molecular Mechanics Poisson-Boltzmann Surface Area versus Absolute Binding Free Energy Calculations: Bromodomains as a Case Study

Affiliations

Statistical Analysis on the Performance of Molecular Mechanics Poisson-Boltzmann Surface Area versus Absolute Binding Free Energy Calculations: Bromodomains as a Case Study

Matteo Aldeghi et al. J Chem Inf Model. .

Abstract

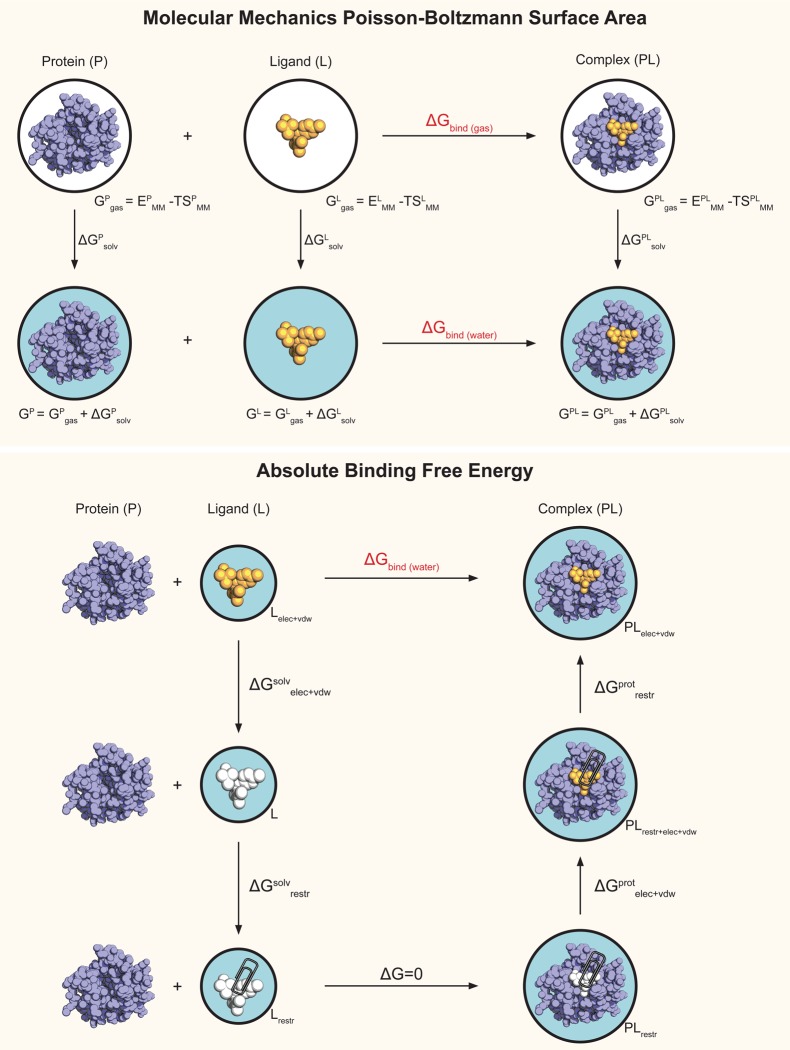
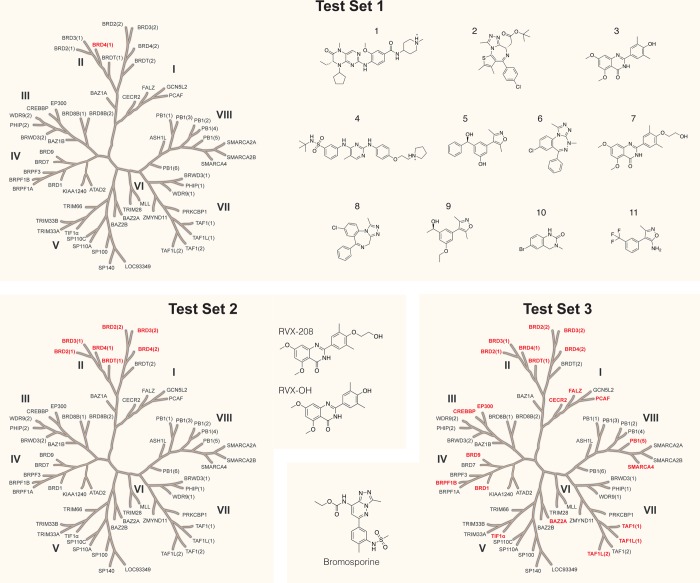
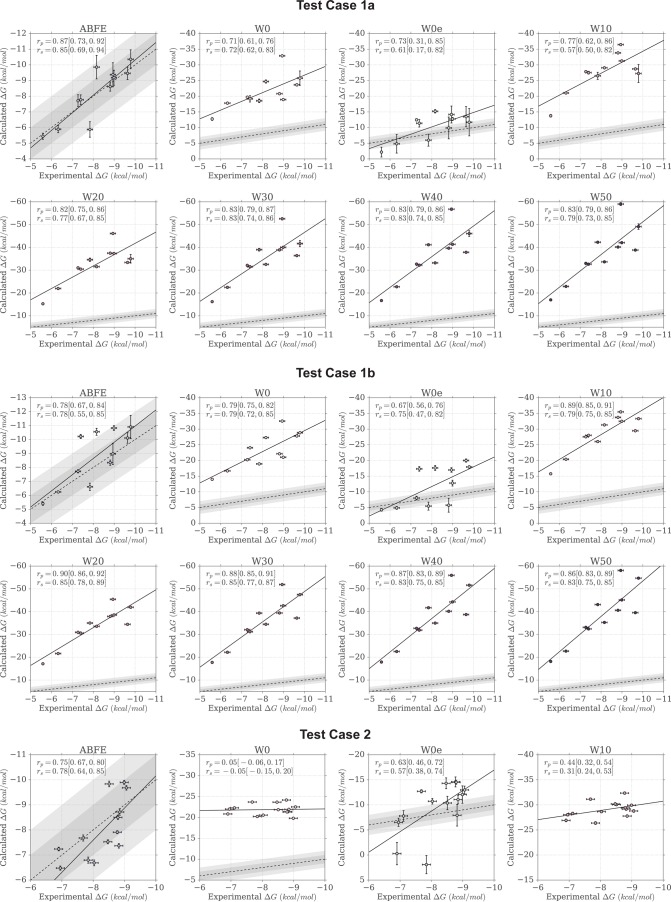
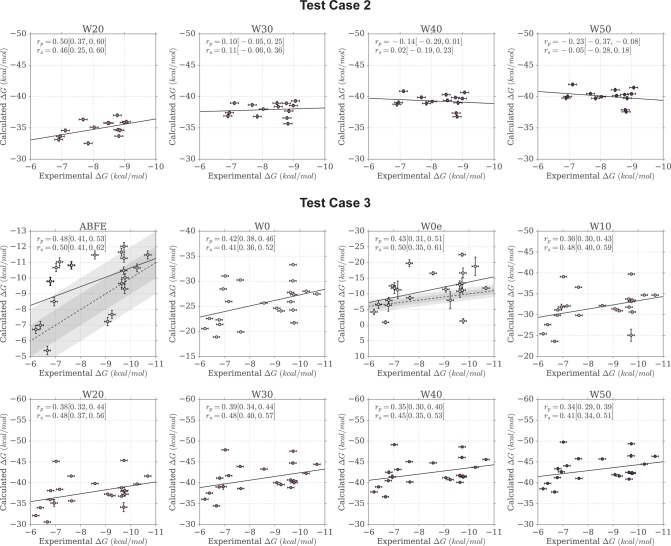
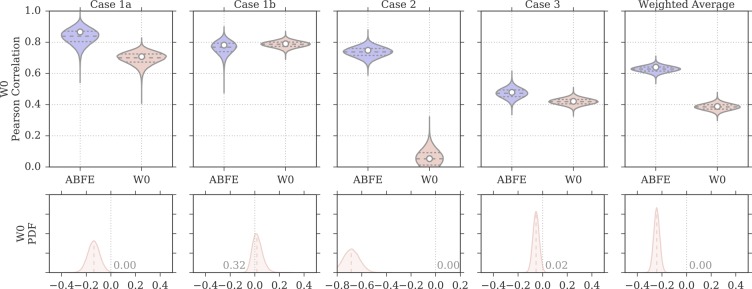
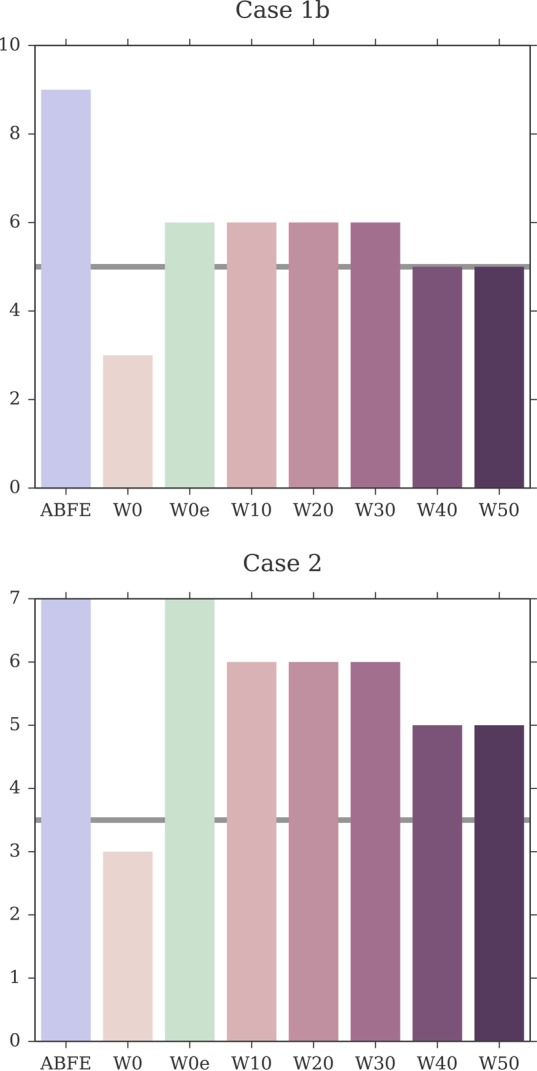
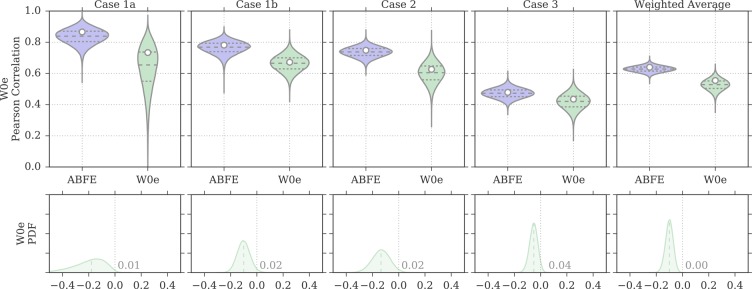
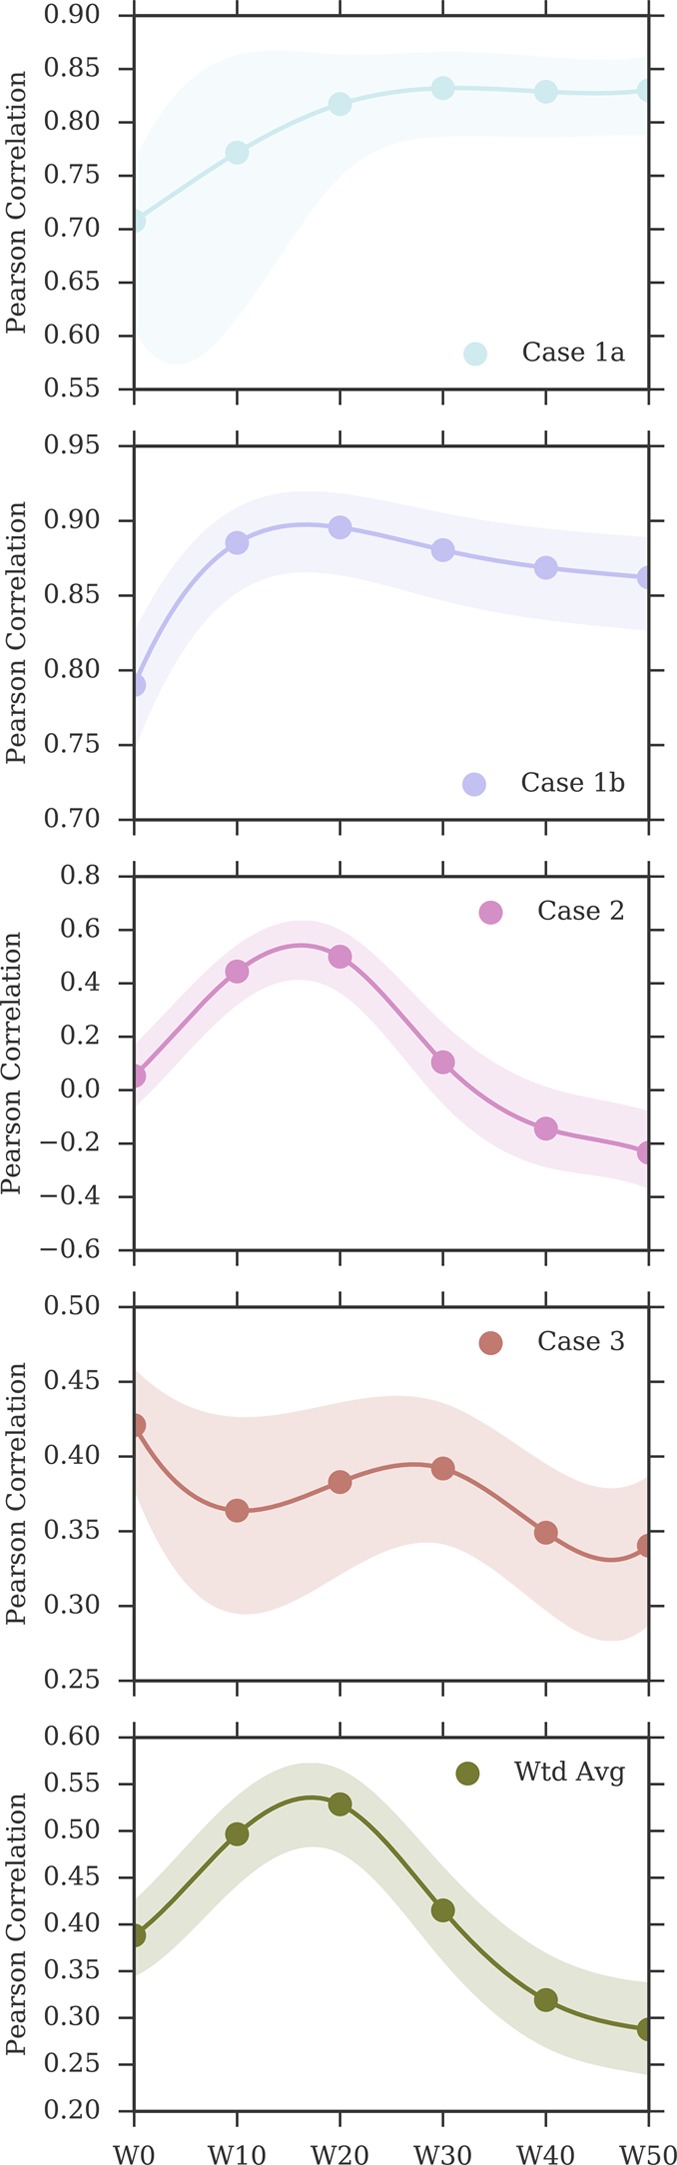
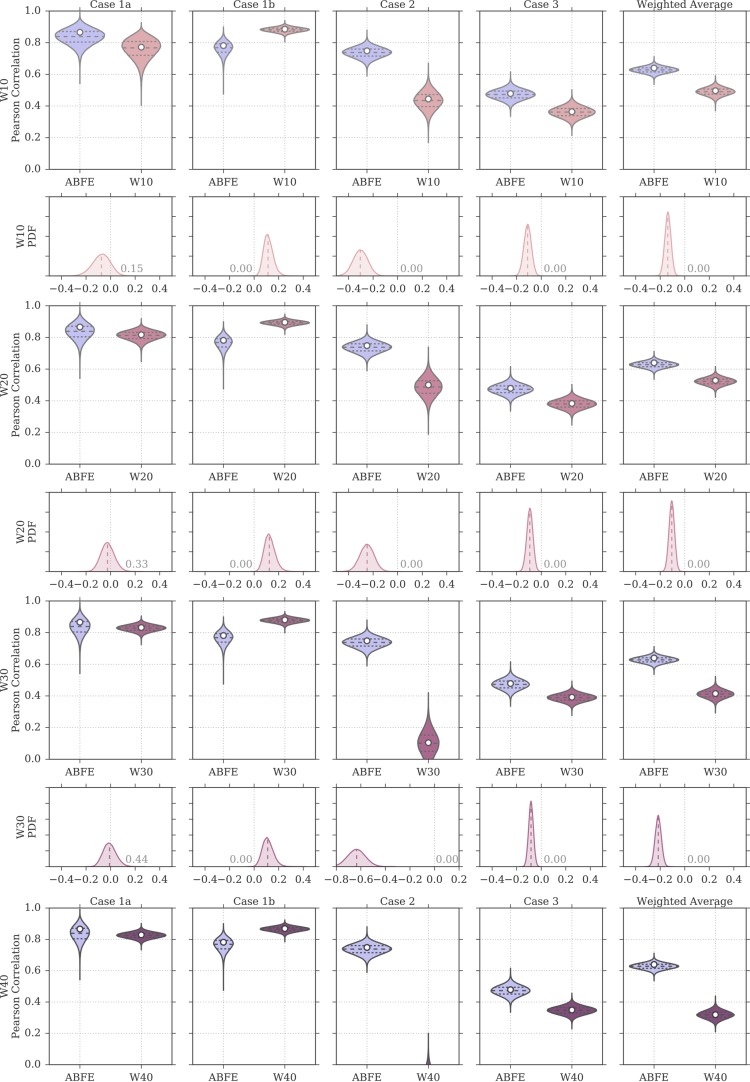
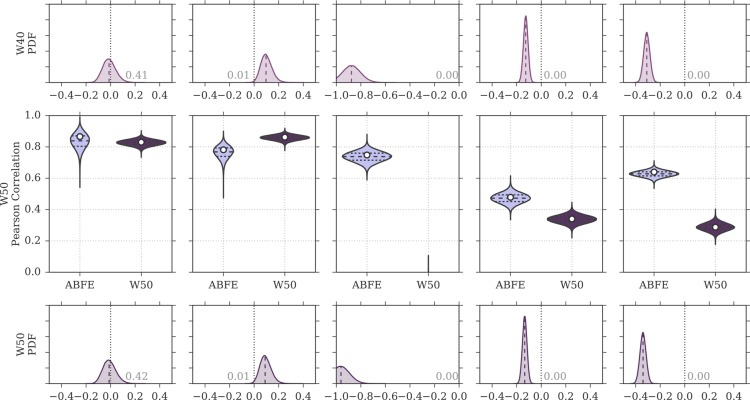
Binding free energy calculations that make use of alchemical pathways are becoming increasingly feasible thanks to advances in hardware and algorithms. Although relative binding free energy (RBFE) calculations are starting to find widespread use, absolute binding free energy (ABFE) calculations are still being explored mainly in academic settings due to the high computational requirements and still uncertain predictive value. However, in some drug design scenarios, RBFE calculations are not applicable and ABFE calculations could provide an alternative. Computationally cheaper end-point calculations in implicit solvent, such as molecular mechanics Poisson-Boltzmann surface area (MMPBSA) calculations, could too be used if one is primarily interested in a relative ranking of affinities. Here, we compare MMPBSA calculations to previously performed absolute alchemical free energy calculations in their ability to correlate with experimental binding free energies for three sets of bromodomain-inhibitor pairs. Different MMPBSA approaches have been considered, including a standard single-trajectory protocol, a protocol that includes a binding entropy estimate, and protocols that take into account the ligand hydration shell. Despite the improvements observed with the latter two MMPBSA approaches, ABFE calculations were found to be overall superior in obtaining correlation with experimental affinities for the test cases considered. A difference in weighted average Pearson ([Formula: see text]) and Spearman ([Formula: see text]) correlations of 0.25 and 0.31 was observed when using a standard single-trajectory MMPBSA setup ([Formula: see text] = 0.64 and [Formula: see text] = 0.66 for ABFE; [Formula: see text] = 0.39 and [Formula: see text] = 0.35 for MMPBSA). The best performing MMPBSA protocols returned weighted average Pearson and Spearman correlations that were about 0.1 inferior to ABFE calculations: [Formula: see text] = 0.55 and [Formula: see text] = 0.56 when including an entropy estimate, and [Formula: see text] = 0.53 and [Formula: see text] = 0.55 when including explicit water molecules. Overall, the study suggests that ABFE calculations are indeed the more accurate approach, yet there is also value in MMPBSA calculations considering the lower compute requirements, and if agreement to experimental affinities in absolute terms is not of interest. Moreover, for the specific protein-ligand systems considered in this study, we find that including an explicit ligand hydration shell or a binding entropy estimate in the MMPBSA calculations resulted in significant performance improvements at a negligible computational cost.


Conflict of interest statement

The authors declare no competing financial interest.

Figures

Figure 1
Figure 1
Overview of the thermodynamic cycles used in MMPBSA and ABFE calculations. A white background indicates a system being in a vacuum, and a light blue background indicates a systems being in aqueous solution. An orange ligand indicates it is fully interacting with the environment, whereas a white ligand indicates it is not interacting with the environment (decoupled state). In the ABFE cycle, a paper clip indicates the presence of restraints.
Figure 2
Figure 2
Overview of the proteins and ligands considered in this study. Three test sets were considered: test set 1 contains 11 different ligands binding to one specific protein; test set 3 contains one ligand binding to 22 different proteins; test set 2 sits in the middle, with two ligands binding to seven proteins. From test set 1, two test cases originate: one that uses the X-ray structures of the protein–ligand complexes (test case 1a) for the simulations, and one that uses ligand poses docked into an apo X-ray structure of the protein (test case 1b). Table S1 summarizes this information in table format.
Figure 3
Figure 3
Scatter plots of calculated versus experimental binding free energies. The areas shaded in gray indicate the 1 and 2 kcal/mol error boundaries. A linear fit to the data is shown as a black line, whereas a dashed line shows the identity line representing a perfect linear fit between experiment and calculations.
Figure 3
Figure 3
Scatter plots of calculated versus experimental binding free energies. The areas shaded in gray indicate the 1 and 2 kcal/mol error boundaries. A linear fit to the data is shown as a black line, whereas a dashed line shows the identity line representing a perfect linear fit between experiment and calculations.
Figure 4
Figure 4
Distributions of Pearson correlation values for the protocol W0 and for ABFE calculations, obtained by bootstrap and based on the uncertainties of the experimental affinity measurements and computational predictions. In the violin plots, the white circle represents the rp value of the original sample, whereas the dashed horizontal lines the first, second, and third quartiles of the bootstrap distribution. The probability density on the bottom row show the distribution of rp for ABFE subtracted from the distribution of rp for MMPBSA. The fraction of the area above or below zero is reported on the plots, the median is shown as a dashed line, and a difference value of zero is marked with a vertical gray dotted line.
Figure 5
Figure 5
Number of correct X-ray binding modes recovered from sets of docking poses by the different approaches. In test case 1b, a variable number of alternative possible poses were evaluated for 10 ligands. In test case 2, two alternative binding modes were evaluated for RVX-OH binding to seven different protein; the ligand is known to bind to four of these proteins with a certain pose, and to the three in a different with a different orientation. The thick horizontal gray line represents the number of X-ray poses expected to be correctly identified on average by chance.
Figure 6
Figure 6
Distributions of Pearson correlation values for the protocol W0e and for ABFE calculations, obtained by bootstrap and based on the uncertainties of the experimental affinity measurements and computational predictions. In the violin plots, the white circle represents the rp value of the original sample, whereas the dashed horizontal lines the first, second, and third quartiles of the bootstrap distribution. The probability density on the bottom row show the distribution of rp for ABFE subtracted from the distribution of rp for MMPBSA. The fraction of the area above or below zero is reported on the plots, the median is shown as a dashed line, and a difference value of zero is marked with a vertical gray dotted line.
Figure 7
Figure 7
Change in Pearson correlation with the inclusion, in the MMPBSA calculations, of larger numbers of explicit water molecules representing the ligand hydration shell. The shaded area represents the 95% CI of the Pearson coefficient. The discrete data points (at W0, W10, W20, W30, W40, W50) have been interpolated with a cubic spline only for visualization purposes. Note the different scales on the y-axis.
Figure 8
Figure 8
Distributions of Pearson correlation values for the protocols W10 to W50 and for ABFE calculations, obtained by bootstrap and based on the uncertainties of the experimental affinity measurements and computational predictions. In the violin plots, the white circle represents the rp value of the original sample, whereas the dashed horizontal lines the first, second, and third quartiles of the bootstrap distribution. The probability density on the even rows show the distribution of rp for ABFE subtracted from the distribution of rp for MMPBSA. The fraction of the area above or below zero is reported on the plots, the median is shown as a dashed line, and a difference value of zero is marked with a vertical gray dotted line.
Figure 8
Figure 8
Distributions of Pearson correlation values for the protocols W10 to W50 and for ABFE calculations, obtained by bootstrap and based on the uncertainties of the experimental affinity measurements and computational predictions. In the violin plots, the white circle represents the rp value of the original sample, whereas the dashed horizontal lines the first, second, and third quartiles of the bootstrap distribution. The probability density on the even rows show the distribution of rp for ABFE subtracted from the distribution of rp for MMPBSA. The fraction of the area above or below zero is reported on the plots, the median is shown as a dashed line, and a difference value of zero is marked with a vertical gray dotted line.

Similar articles

Cited by

References

    1. Perez A.; Morrone J. A.; Simmerling C.; Dill K. A. Advances in Free-Energy-Based Simulations of Protein Folding and Ligand Binding. Curr. Opin. Struct. Biol. 2016, 36, 25–31. 10.1016/j.sbi.2015.12.002. - DOI - PMC - PubMed
    1. Larsson P.; Hess B.; Lindahl E. Algorithm Improvements for Molecular Dynamics Simulations. Wiley Interdiscip. Rev. Comput. Mol. Sci. 2011, 1, 93–108. 10.1002/wcms.3. - DOI
    1. Shirts M. R.; Mobley D. L.; Brown S. P.. Free-Energy Calculations in Structure-Based Drug Design. In Drug Design; Merz K. M.; Ringe D.; Reynolds C. H., Eds.; Cambridge University Press, 2010; pp 61–86.
    1. Kollman P. A.; Massova I.; Reyes C.; Kuhn B.; Huo S.; Chong L.; Lee M.; Lee T.; Duan Y.; Wang W.; Donini O.; Cieplak P.; Srinivasan J.; Case D. A.; Cheatham T. E. Calculating Structures and Free Energies of Complex Molecules: Combining Molecular Mechanics and Continuum Models. Acc. Chem. Res. 2000, 33, 889–897. 10.1021/ar000033j. - DOI - PubMed
    1. Genheden S.; Ryde U. The MM/PBSA and MM/GBSA Methods to Estimate Ligand-Binding Affinities. Expert Opin. Drug Discovery 2015, 10, 449–461. 10.1517/17460441.2015.1032936. - DOI - PMC - PubMed

Publication types