. 2017 Aug 8;18(8):1727.
doi: 10.3390/ijms18081727.

Spatial Distribution Patterns of Root-Associated Bacterial Communities Mediated by Root Exudates in Different Aged Ratooning Tea Monoculture Systems

Affiliations

Spatial Distribution Patterns of Root-Associated Bacterial Communities Mediated by Root Exudates in Different Aged Ratooning Tea Monoculture Systems

Yasir Arafat et al. Int J Mol Sci. .

Abstract

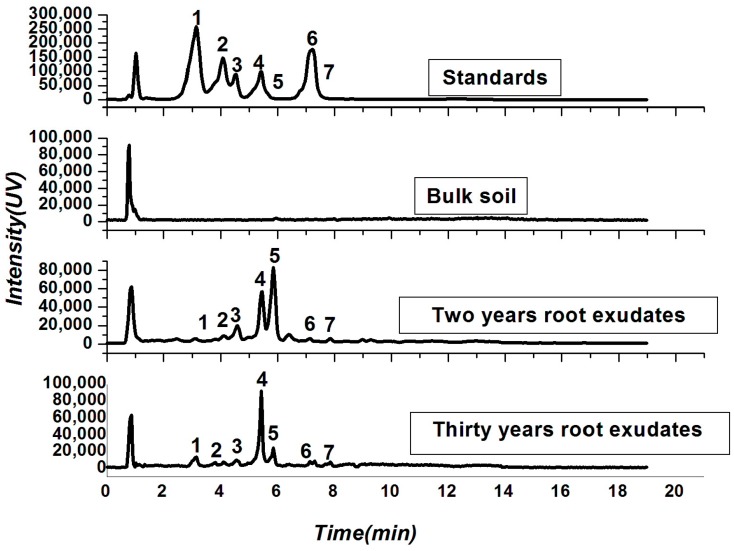
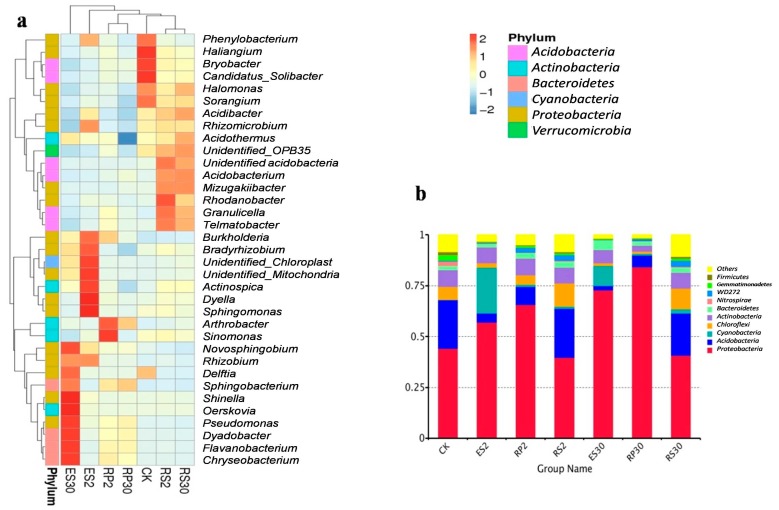
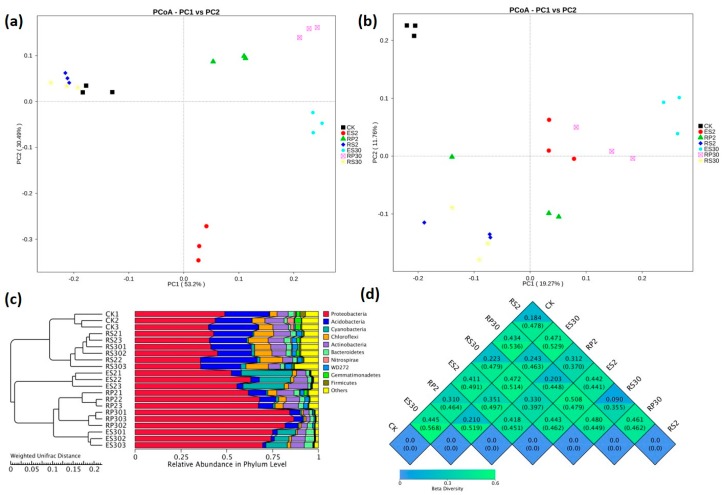
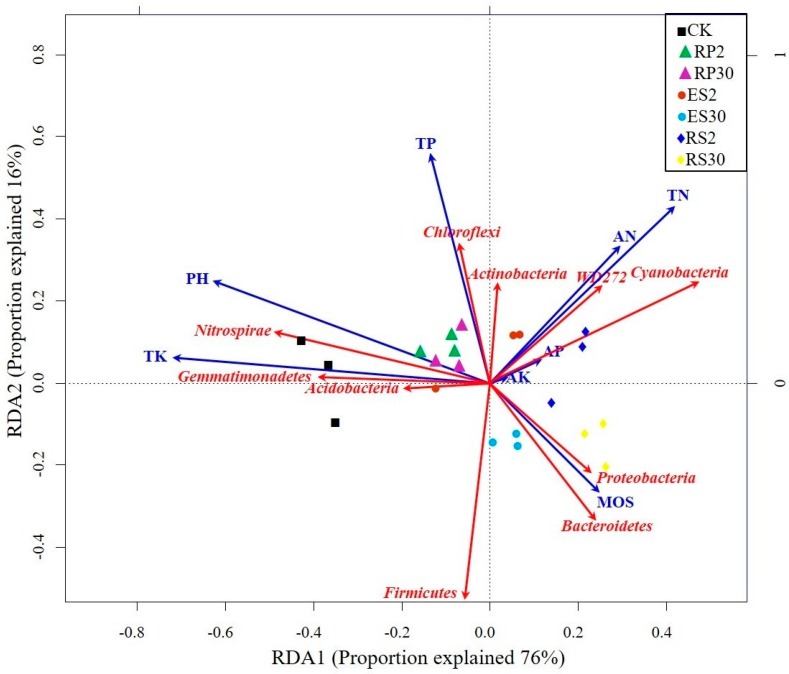
Positive plant-soil feedback depends on beneficial interactions between roots and microbes for nutrient acquisition; growth promotion; and disease suppression. Recent pyrosequencing approaches have provided insight into the rhizosphere bacterial communities in various cropping systems. However; there is a scarcity of information about the influence of root exudates on the composition of root-associated bacterial communities in ratooning tea monocropping systems of different ages. In Southeastern China; tea cropping systems provide the unique natural experimental environment to compare the distribution of bacterial communities in different rhizo-compartments. High performance liquid chromatography-electrospray ionization-mass spectrometry (HPLC-ESI-MS) was performed to identify and quantify the allelochemicals in root exudates. A high-throughput sequence was used to determine the structural dynamics of the root-associated bacterial communities. Although soil physiochemical properties showed no significant differences in nutrients; long-term tea cultivation resulted in the accumulation of catechin-containing compounds in the rhizosphere and a lowering of pH. Moreover; distinct distribution patterns of bacterial taxa were observed in all three rhizo-compartments of two-year and 30-year monoculture tea; mediated strongly by soil pH and catechin-containing compounds. These results will help to explore the reasons why soil quality and fertility are disturbed in continuous ratooning tea monocropping systems; and to clarify the associated problems.

Keywords: allelochemicals; high performance liquid chromatography-electrospray ionization-mass spectrometry (HPLC–ESI–MS); high-throughput sequence; microbiomes; monoculture; redundancy analysis (RDA); rhizo-compartments.


Conflict of interest statement

The authors declare no conflict of interest.

Figures

Figure 1
Figure 1
High performance liquid chromatography–electrospray ionization–mass spectrometry (HPLC–ESI–MS) spectra of catechins in root exudates collected from different plantations of different ages tea fields and bulk soil; “1”represents protocatechuic acid (PCA) with a retention time of 3.12 min; “2”represents epigallocatechin (EGC) with a retention time of 4.07 min; “3” represents epigallocatechin-3-gallate (EGCG) with a retention time of 4.53 min; “4” represents epicatechin (EC) with a retention time of 5.43 min; “5” represents (+)-catechin (C) with a retention time of 5.72 min; “6” represents epicatechin-3-gallate (ECG) with a retention time of 7.13 min; and “7” represents taxifolin (TF) with a retention time of 7.32 min.
Figure 2
Figure 2
The rarefaction curve based on 97% similarity. CK1, CK2, CK3 refer to the bulk soil, RS21, RS22, RS23 represent rhizosphere of the two-year-old tea plantation, RP21, RP22, RP23 represent rhizoplane of the two-year-old tea plantation, and ES21, ES22, ES23 represent endosphere of the two-year-old tea plantation respectively. While RS301, RS302, RS303 represent rhizosphere of the thirty-year-old tea plantation, RP301, RP302, RP303 represent rhizoplane of the thirty-year-old tea plantation, and ES301, ES302, ES303 represent endosphere of the thirty-year-old tea plantation respectively.
Figure 3
Figure 3
(a) Heat map showing the distribution of the 35 most abundant genera. (b) Distribution of the top 10 most abundant phyla in bulk soil (CK), rhizosphere of the two-year-old tea plantation (RS2), rhizoplane of the two-year-old tea plantation (RP2), endosphere of the two-year-old tea plantation (ES2), rhizosphere of the thirty-year-old tea plantation (RS30), rhizoplane of the thirth-year-old tea plantation (RP30) and endosphere of the thirty-year-old tea plantation (ES30).
Figure 4
Figure 4
α-diversity indices including calculations of (a) abundance-based coverage estimators (ACE), (b) Chao1, (c) Shannon, and (d) Simpson in bulk soil (CK) and in various rhizo-compartments of different tea plantations of different ages: RS2, RP2, ES2, RS30, EP30 and ES30.
Figure 5
Figure 5
Biplot ordination of (a) weighted UniFrac principal coordinate analysis (PCoA) and (b) Unweighted UniFrac (UUF) principal coordinate analysis (PCoA) among various samples. CK represents a nearby uncultivated field, while RS2, RP2, and ES2 represent the rhizosphere, rhizoplane, and endosphere of the two-year tea plantation, and RS30, RP30, and ES30 represent the rhizosphere, rhizoplane, and endosphere of the 30-year-old tea plantation. (c) UPGMA/hierarchical clustering analysis based on weighted UniFrac distances showing the relative abundance of the most abundant bacterial phylum in various rhizo-compartments of different tea plantations of different ages. (d) β-diversity heat map based on weighted (WUF) and unweighted (UUF) UniFrac distances. Values in the upper and lower corners represented the WUF and UUF distances.
Figure 6
Figure 6
Redundancy analysis (RDA) Triplot (RDA on a covariance matrix) of the correlation between the most abundant phylum of bacteria and soil physiochemical properties, such as total phosphorus (TP), total nitrogen (TN), available nitrogen (AN), available potassium (AK), available phosphorus (AP), and pH across the various rhizo-compartments of the different tea plantations of different ages, where rhizosphere RS2 and RS30 are the rhizosphere, RP2 and RP30 are the rhizoplane, and endosphere ES2 and ES30 are the endosphere in two-year and 30-year-old tea gardens, respectively. The arrow length and direction correspond to the variance that can be explained by the environmental and response variables. The direction of an arrow indicates the extent to which the given factor is influenced by each RDA variable. The perpendicular distance between the abundance of bacterial phyla and environmental variable axes in the plot reflects their correlations. The smaller the distance, the stronger the correlation.
Figure 7
Figure 7
RDA Triplot (RDA on a covariance matrix) of the correlation between the most abundant phylum of bacteria and root exudates, such as C, EGC, EC, TF, and PCA, across various rhizo-compartments of different tea plantations of different ages, where the rhizosphere is represented by RS2 and RS30, the rhizoplane by RP2 and RP30, and the endosphere by ES2 and ES30, in two-year and 30-year-old tea gardens, respectively. The arrow length and direction correspond to the variance that can be explained by the environmental and response variables. The direction of the arrow indicates the extent to which the given factor is influenced by each RDA variable. The perpendicular distance between abundance of the bacterial phyla and the environmental variable axes in the plot reflects their correlations. The smaller the distance, the stronger the correlation.

References

    1. Bever J.D., Westover K.M., Antonovics J. Incorporating the soil community into plant population dynamics: The utility of the feedback approach. J. Ecol. 1997;85:561–573. doi: 10.2307/2960528. - DOI
    1. Bever J.D. Soil community feedback and the coexistence of competitors: Conceptual frameworks and empirical tests. New Phytol. 2003;157:465–473. doi: 10.1046/j.1469-8137.2003.00714.x. - DOI - PubMed
    1. Kulmatiski A., Beard K.H., Stevens J.R., Cobbold S.M. Plantntitors: Conceptual fra-analytical review. Ecol. Lett. 2008;11:980–992. doi: 10.1111/j.1461-0248.2008.01209.x. - DOI - PubMed
    1. Putten W.H., Bardgett R.D., Bever J.D., Bezemer T.M., Casper B.B., Fukami T., Kardol P., Klironomos J.N., Kulmatiski A., Schweitzer J.A. Plant–soil feedbacks: The past, the present and future challenges. J. Ecol. 2013;101:265–276. doi: 10.1111/1365-2745.12054. - DOI
    1. Baxendale C., Orwin K.H., Poly F., Pommier T., Bardgett R.D. Are plant–soil feedback responses explained by plant traits? New Phytol. 2014;204:408–423. doi: 10.1111/nph.12915. - DOI - PubMed

LinkOut - more resources