Multicenter Study
. 2017 Sep 5;117(6):888-897.
doi: 10.1038/bjc.2017.236. Epub 2017 Aug 8.

Evidence of advanced stage colorectal cancer with longer diagnostic intervals: a pooled analysis of seven primary care cohorts comprising 11 720 patients in five countries

Affiliations
Multicenter Study

Evidence of advanced stage colorectal cancer with longer diagnostic intervals: a pooled analysis of seven primary care cohorts comprising 11 720 patients in five countries

M L Tørring et al. Br J Cancer. .

Abstract

Background: The benefits from expedited diagnosis of symptomatic cancer are uncertain. We aimed to analyse the relationship between stage of colorectal cancer (CRC) and the primary and specialist care components of the diagnostic interval.

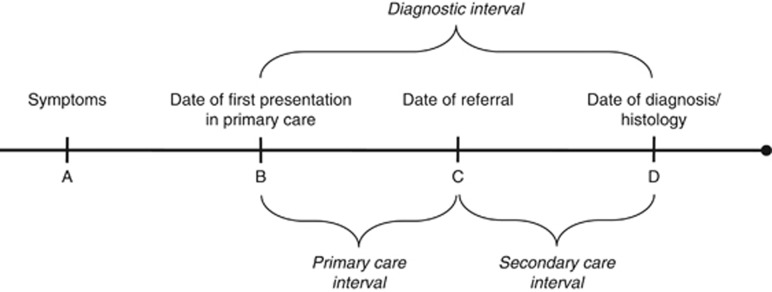
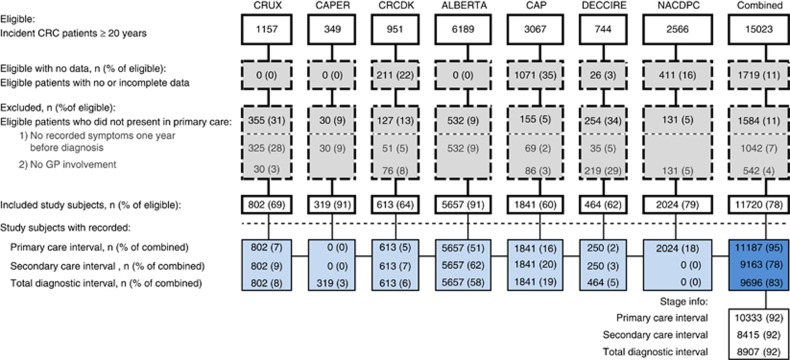
Methods: We identified seven independent data sets from population-based studies in Scotland, England, Canada, Denmark and Spain during 1997-2010 with a total of 11 720 newly diagnosed CRC patients, who had initially presented with symptoms to a primary care physician. Data were extracted from patient records, registries, audits and questionnaires, respectively. Data sets were required to hold information on dates in the diagnostic interval (defined as the time from the first presentation of symptoms in primary care until the date of diagnosis), symptoms at first presentation in primary care, route of referral, gender, age and histologically confirmed stage. We carried out reanalysis of all individual data sets and, using the same method, analysed a pooled individual patient data set.

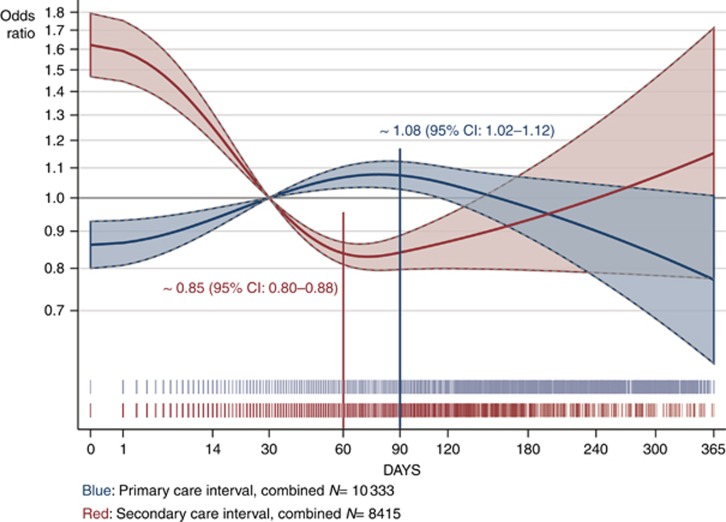
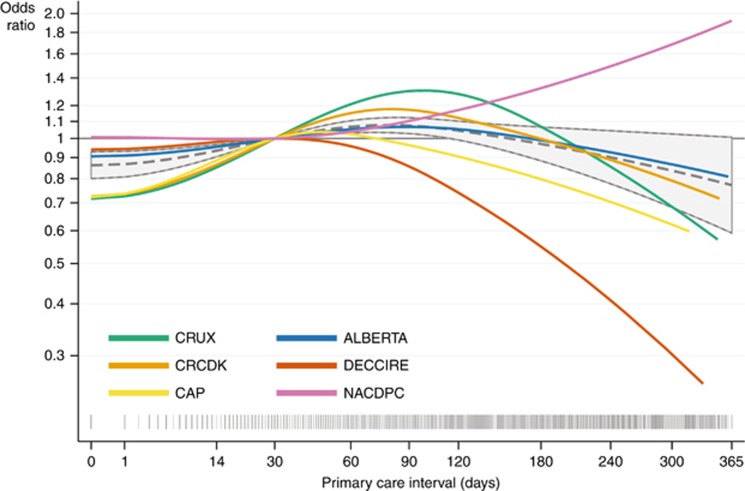
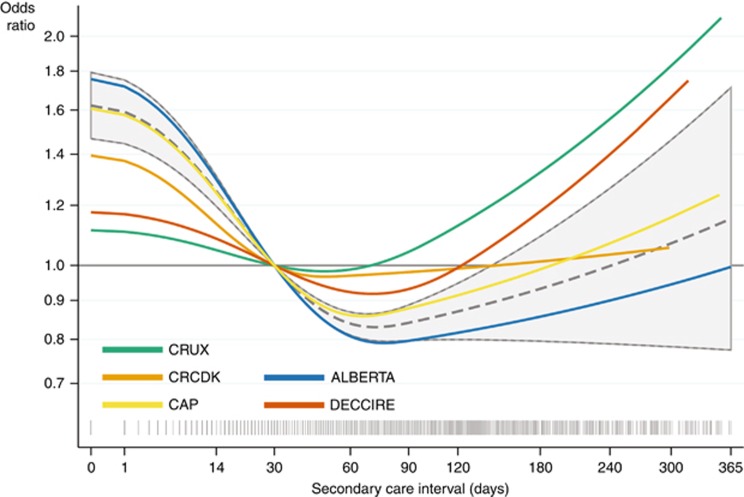
Results: The association between intervals and stage was similar in the individual and combined data set. There was a statistically significant convex (∩-shaped) association between primary care interval and diagnosis of advanced (i.e., distant or regional) rather than localised CRC (P=0.004), with odds beginning to increase from the first day on and peaking at 90 days. For specialist care, we saw an opposite and statistically significant concave (∪-shaped) association, with a trough at 60 days, between the interval and diagnosis of advanced CRC (P<0.001).

Conclusions: This study provides evidence that longer diagnostic intervals are associated with more advanced CRC. Furthermore, the study cannot define a specific 'safe' waiting time as the length of the primary care interval appears to have negative impact from day one.


Conflict of interest statement

The authors declare no conflict of interest.

Figures

Figure 1
Figure 1
Definition of exposure variables. We calculated three exposure variables based on information on date of first presentation of symptoms in primary care (B); date of referral to a cancer specialist centre (C); and date of diagnosis (D). ‘The primary care interval’ is defined as (B, C)=time from first presentation to referral to a cancer specialist centre. ‘The secondary care interval’ is defined as (C, D)=time from referral to diagnosis). ‘The total diagnostic interval’ is defined as (B, D)=time from first presentation to diagnosis. Information on date of first symptom (A) was not available.
Figure 2
Figure 2
Patient flow for each colorectal cancer cohort data set and all data combined. CAP=Cancer in Primary Care; CAPER=Cancer Prediction in Exeter; CRC=colorectal cancer; CRCDK=Colorectal Cancer in Denmark; CRUX=Comparing Rural and Urban Cancer Care; DECCIRE=Delay Cancer Colon i Recto; NACDPD=National Audit of Cancer Diagnosis in Primary Care.
Figure 3
Figure 3
The risk of being diagnosed with advanced colorectal cancer as a function of time to diagnosis. Estimated odds ratios of being diagnosed with advanced (distant or regional) vs localised colorectal cancer as a function of the length of the primary care interval (blue) and the secondary care interval (red) analysed for all cohorts combined (patients with unknown tumour stage excluded). We adjusted for age, gender, alarm symptoms and cohort. The area around the fitted curves indicates 95% confidence limits. The spikes below the curves show the distribution of the primary care interval (blue) and secondary care interval (red) on a squared scale. The grey horizontal lines indicate the chosen reference point of 30 days (see logistic regression details in Supplementary Table'4, Supplementary Material IV). Crude estimates are not shown.
Figure 4
Figure 4
The risk of being diagnosed with advanced colorectal cancer as a function of time from presentation to referral. Estimated odds ratios of being diagnosed with advanced (distant or regional) vs localised colorectal cancer as a function of the length of the primary care interval (time from first presentation of symptoms to referral); analysed for six cohorts (in total 10 333 patients). We excluded patients with unknown tumour stage excluded and adjusted for age, gender and alarm symptoms at first presentation. The grey dashed curves with 95% confidence limits are fitted on the combined data sets with grey spikes showing the distribution of the care intervals on a squared scale. The grey horizontal lines indicate the chosen reference point of 30 days. Crude estimates are not shown.
Figure 5
Figure 5
The risk of being diagnosed with advanced colorectal cancer as a function of time from referral to diagnosis. Estimated odds ratios of being diagnosed with advanced (distant or regional) vs localised colorectal cancer as a function of the length of the secondary care interval (time from referral to diagnosis) analysed for five cohorts (in total 8415 patients). We excluded patients with unknown tumour stage and adjusted for age, gender and alarm symptoms at first presentation. The grey dashed curves with 95% confidence limits are fitted on the combined data sets with grey spikes showing the distribution of the care intervals on a squared scale. The grey horizontal lines indicate the chosen reference point of 30 days. Crude estimates are not shown.

References

    1. Adelstein BA, Irwig L, Macaskill P, Katelaris PH, Jones DB, Bokey L (2008) A self administered reliable questionnaire to assess lower bowel symptoms. BMC Gastroenterol 8: 8. - PMC - PubMed
    1. Afzelius P, Zedeler K, Sommer H, Mouridsen HT, Blichert-Toft M (1994) Patient’s and doctor’s delay in primary breast cancer: prognostic implications. Acta Oncol 33: 345–351. - PubMed
    1. Banks J, Walter FM, Hall N, Mills K, Hamilton W, Turner KM (2014) Decision making and referral from primary care for possible lung and colorectal cancer: a qualitative study of patients’ experiences. Br J Gen Pract 64: e775–e782. - PMC - PubMed
    1. Benitez-Majano S, Fowler H, Maringe C, Di Girolamo C, Rachet B (2016) Deriving stage at diagnosis from multiple population-based sources: colorectal and lung cancer in England. Br J Cancer 115: 391–400. - PMC - PubMed
    1. Crawford SC, Davis JA, Siddiqui NA, de Caestecker L, Gillis CR, Hole D, Penney G (2002) The waiting time paradox: population based retrospective study of treatment delay and survival of women with endometrial cancer in Scotland. BMJ 325: 196. - PMC - PubMed

Publication types

MeSH terms