. 2017 Aug 7;13(8):e1006422.
doi: 10.1371/journal.ppat.1006422. eCollection 2017 Aug.

Infection-adapted emergency hematopoiesis promotes visceral leishmaniasis

Affiliations

Infection-adapted emergency hematopoiesis promotes visceral leishmaniasis

Belma Melda Abidin et al. PLoS Pathog. .

Abstract

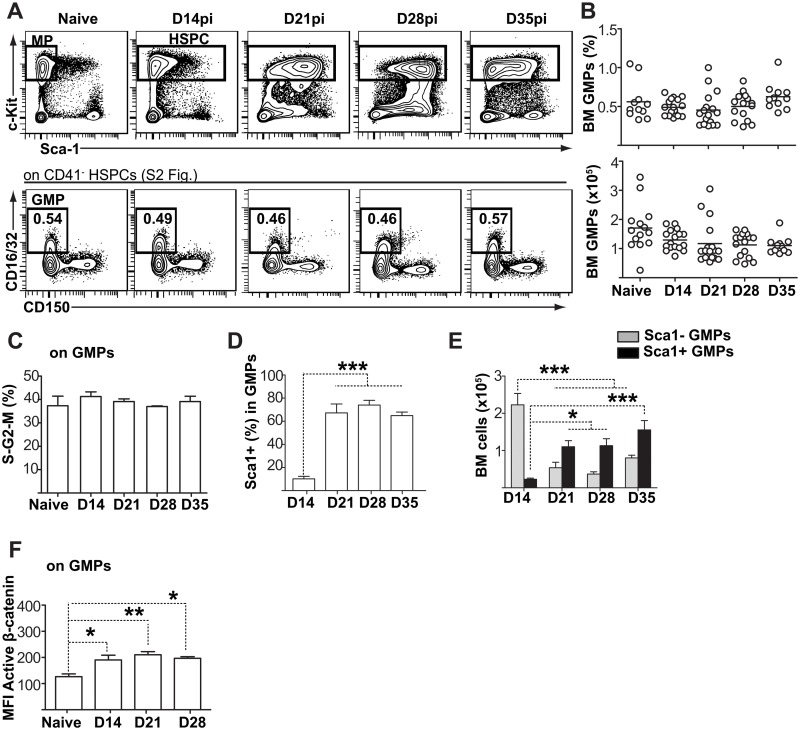
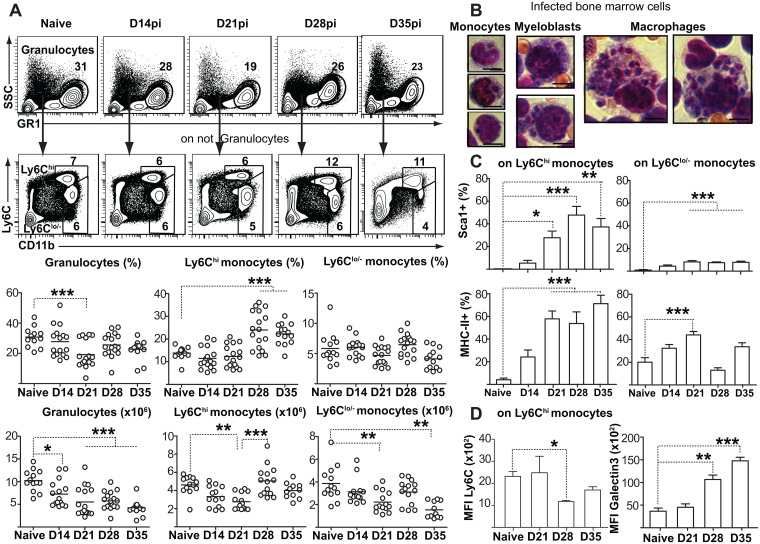
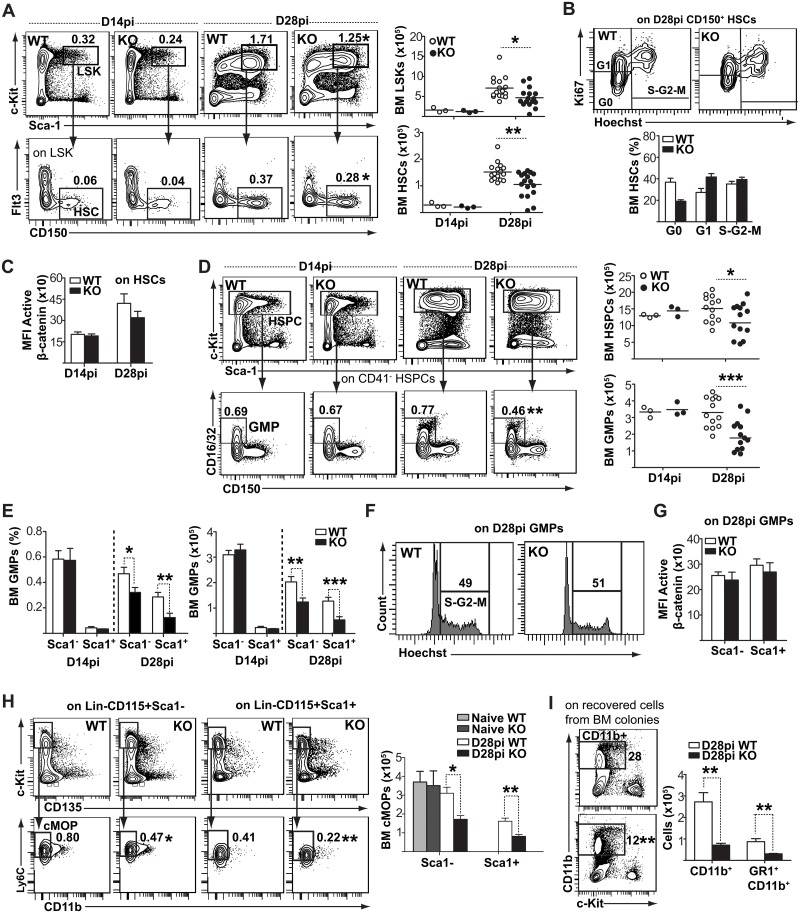
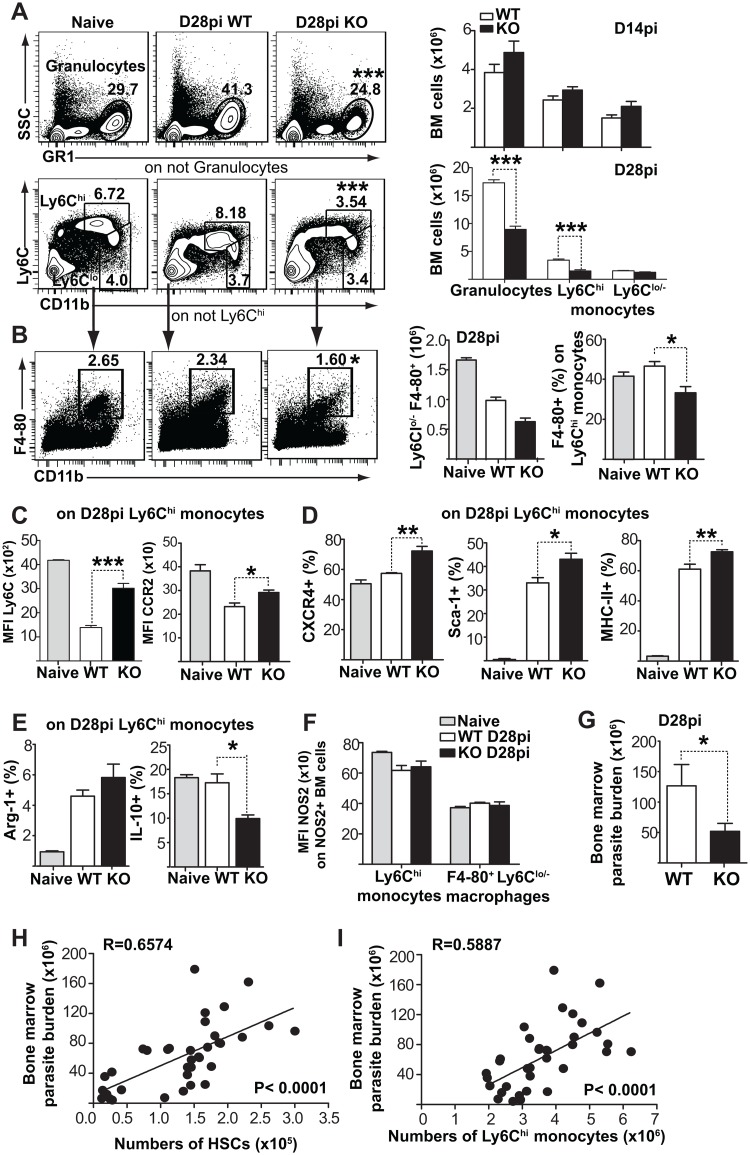
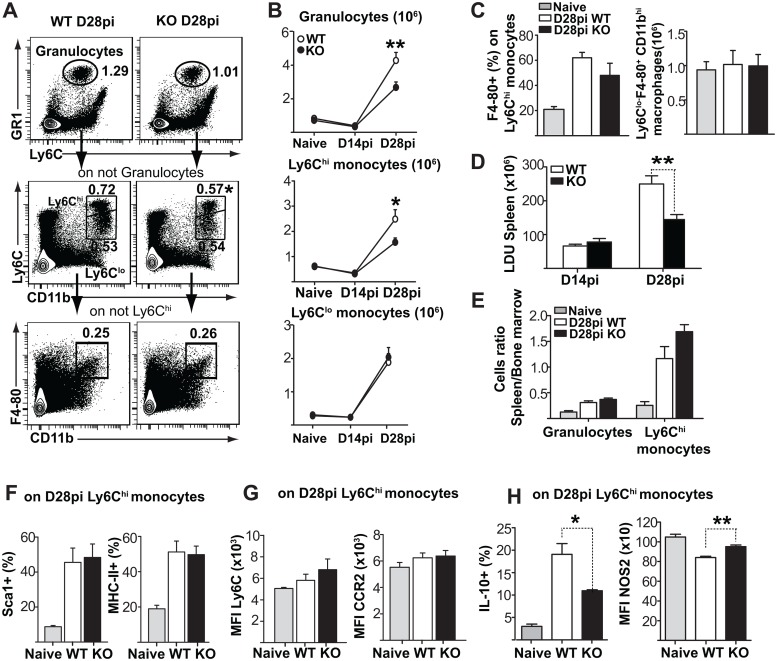
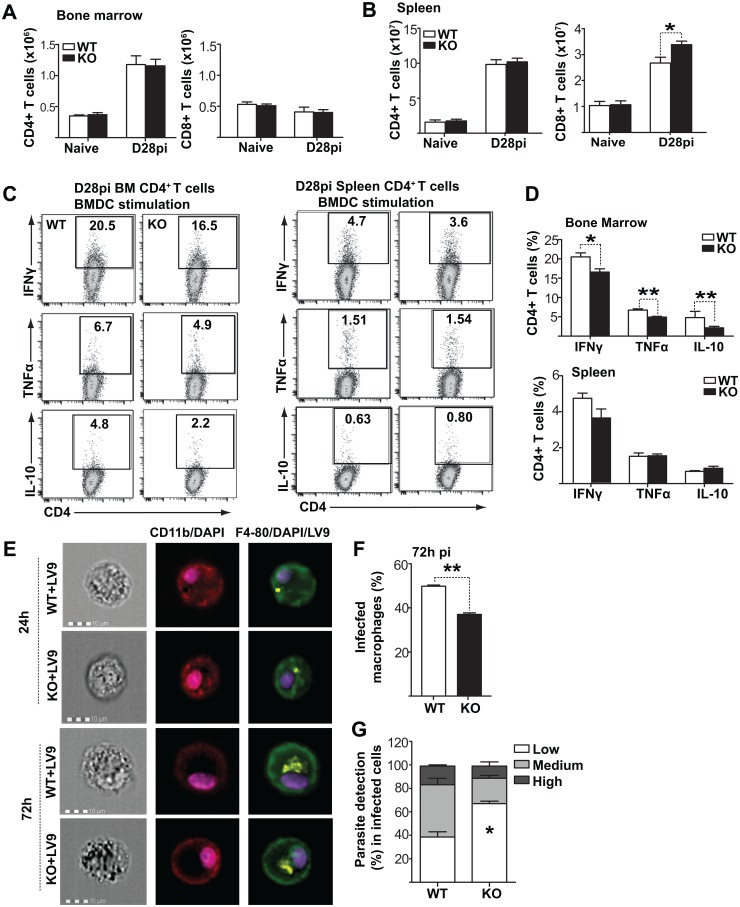
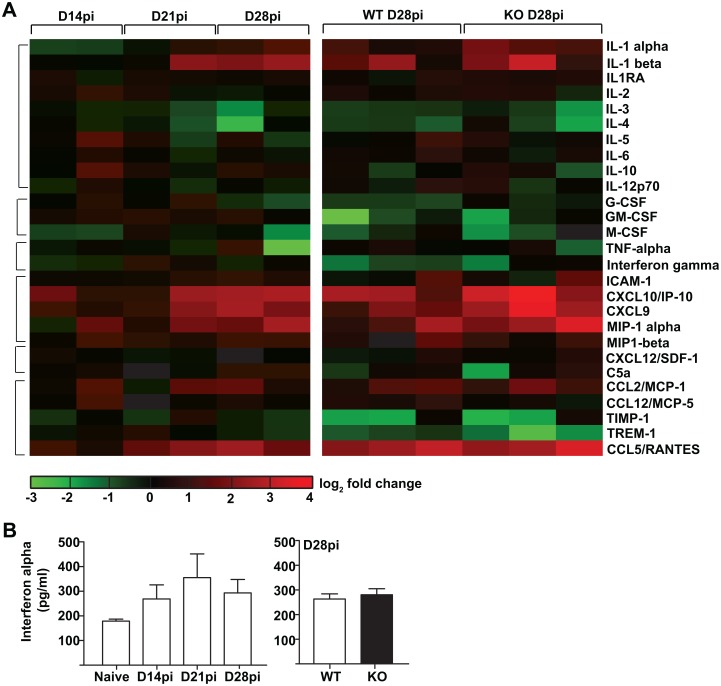
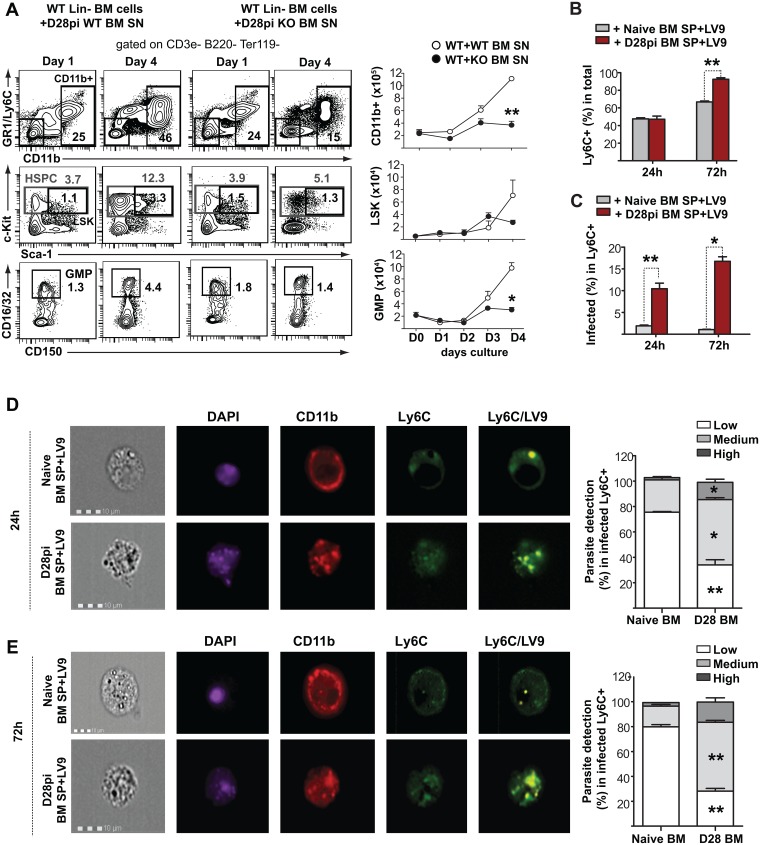
Cells of the immune system are derived from hematopoietic stem cells (HSCs) residing in the bone marrow. HSCs become activated in response to stress, such as acute infections, which adapt the bone marrow output to the needs of the immune response. However, the impact of infection-adapted HSC activation and differentiation on the persistence of chronic infections is poorly understood. We have examined here the bone marrow outcome of chronic visceral leishmaniasis and show that the parasite Leishmania donovani induces HSC expansion and skews their differentiation towards non-classical myeloid progenitors with a regulatory phenotype. Our results further suggest that emergency hematopoiesis contributes to the pathogenesis of visceral leishmaniasis, as decreased HSC expansion results in a lower parasite burden. Conversely, monocytes derived in the presence of soluble factors from the infected bone marrow environment are more permissive to infection by Leishmania. Our results demonstrate that L. donovani is able to subvert host bone marrow emergency responses to facilitate parasite persistence, and put forward hematopoiesis as a novel therapeutic target in chronic infections.


Conflict of interest statement

The authors have declared that no competing interests exist.

Figures

Fig 1
Fig 1. Parasite expansion coincides with proliferation and accumulation of bone marrow hematopoietic stem/progenitor cells (HSPC).
(A) Bone marrow parasite burden was assessed using the serial limiting dilution technique. Graph shows parasite burden per one femur and one tibia. (B) Representative flow cytometry data and gating strategy of BM HSPCs. BM cells were first gated on Lin- (B220-CD3ε-CD11b-GR1-Ter119-) and identified according to Sca1 and cKit (CD117) expression. HSCs were defined as CD150+ CD16/CD32- within the Lin-cKithi Sca1+ (LSK) population. Numbers within flow cytometry plots represent mean LSK percentage within total bone marrow and mean HSC percentage within LSKs. See also S1 Fig. (C) Histograms show percentage and absolute numbers of LSKs and HSCs per two femora and two tibiae. Data are pooled from three independent experiments, with each individual dot representing one mouse. Horizontal lines represent the sample mean. (D) Absolute numbers of LSKs and CD150+ HSCs in spleens of infected mice. See also S1 Fig. (E) Ki-67/Hoechst co-staining was used to distinguish the G0, G1, and S/G2/M cell cycle phases of CD150+ HSC-like cells during infection. (F) Analysis of CD48 expression within BM CD150+ HSC-like cells. Numbers within flow cytometry plots represent CD48+ and CD48- HSC subsets within CD150+ HSC like cells. (G) Graphs depict the numbers of cells for the two subsets at various time points after infection. (H) Intracellular active β-catenin levels (MFI) within CD150+ HSC-like cells. See also S1 Fig. All bar graphs represent mean + SEM with 4 mice per group coming from one single infection. Similar results were obtained in two additional independent experiments. *P<0.05; **P<0.01; ***P<0.001.
Fig 2
Fig 2. Bone marrow HSCs switch their differentiation towards non-classical myeloid progenitors.
(A) Representative flow cytometry data and gating strategy of granulocyte-monocyte progenitors (GMPs) in the bone marrow. Steady state myeloid progenitor (MP) cells were first gated on Lin-Sca1-c-kithi and then subdivided according to the expression of CD41, CD150 and CD16/CD32. GMPs were identified as CD16/CD32+ CD41- CD150-. Due to the inflammation-induced shift in Sca1 expression, the total Lin- c-Kithi HSPC population was included for analysis during infection. See also S2 Fig. (B) Graphs show percentage and absolute numbers of GMPs at various time points. Data are pooled from three independent experiments, with each individual dot representing one mouse. Horizontal lines represent the sample mean. (C) Percentage of GMPs in S/G2/M phases of cell cycle. (D) Percentage of Sca-1+ emergency GMPs within all GMPs. (E) Numbers of cells within Sca-1+ and Sca-1- GMP subsets. (F) Intracellular active β-catenin levels (MFI) in GMPs.
Fig 3
Fig 3. Leishmania parasite expansion promotes myeloid output in the bone marrow.
(A) Representative flow cytometry data to demonstrate gating strategy for myeloid cell subsets in the bone marrow. Graphs show percentage and numbers of granulocytes (GR1hi SSChi), mature monocytes (Ly6ChiCD11b+) and remaining immature/resident myelo-monocytes (Ly6Clo/- GR1lo/- CD11b+). Data are pooled from three independent experiments, with each individual dot representing one mouse. Horizontal lines represent the sample mean. See also S3 Fig. (B) Giemsa-stained infected bone marrow monocytes, myeloblast-like cells and macrophages bearing intracellular Leishmania amastigotes (100 X under oil immersion lens). Scale bar = 5μm. (C) Sca-1 and MHC-II expression on Ly6Chi and Ly6Clo/- monocyte subsets. (D) Galectin and Ly6C expression (MFI) on Ly6Chi monocytes. All bar graphs represent mean + SEM with 4 mice per group coming from one single infection. Similar results were obtained in a second, independent experiment. *P<0.05; **P<0.01; ***P<0.001.
Fig 4
Fig 4. Frizzled-6 is required for parasite-induced expansion and myeloid differentiation of HSPCs.
(A) Analysis of bone marrow LSK and HSC compartments in infected Fzd6-/- (KO) and Fzd6+/+ (WT) mice. Mean percentage for LSKs and HSC-like cells within total bone marrow are indicated in the corner of each histogram. Graphs show the numbers of LSKs and HSCs on days 14 and 28. Day 28 data are pooled from three independent experiments, with each individual dot representing one mouse. Horizontal lines represent the sample mean. (B) Representative flow-cytometry plots for cell cycle analysis of WT and KO HSCs on day 28. Graph shows percent CD150+ HSC like cells in the G0, G1 and S-G2-M phases of cell cycle. (C) Intracellular active β-catenin levels (MFI) in WT and KO CD150+ HSCs on days 14 and 28. (D) Flow cytometry analysis of BM GMPs. Numbers in the histograms represent mean percentage for WT and KO GMPs. Graphs show the numbers of HSPCs and GMPs at day 14 and 28. Day 28 data are pooled from three independent experiments, with each individual dot representing one mouse. See also S4, S5 and S6 Figs. (E) Percentage and numbers of Sca-1- and Sca-1+ GMPs on day 14 and 28 pi. (F) Cell cycle analysis of WT and KO GMPs on day 28. Similar results were obtained from six individual mice for each group. (G) Intracellular active β-catenin levels (MFI) in different GMP subsets on day 28. (H) Gating strategy and representative flow cytometry plots for common monocyte progenitors (cMoPs). BM cells were first gated on Lin- (CD3εB220NK1.1Ly6G) CD115+ and then subdivided according to Sca1. cMoPs were identified as cKit+CD135-Ly6C+CD11b- within Lin- CD115+ cell populations. Mean percentage for cMoPs within total bone marrow is depicted in flow cytometry plots, and the graph shows absolute numbers (mean + SEM from six mice per group). To note, there were no Sca1+ cMoPs in naïve mice. (I) Flow cytometry analysis of cells recovered from myeloid colony forming assays. Numbers shown in different quadrants indicate the mean percentage in CD11b+ cells. Histogram represents pooled data from one single infection for a total of five mice. Similar results were obtained in a second, independent experiment. All bar graphs represent mean + SEM with 10 mice per group for day 28 pooled from two independent experiments and 3 mice per group for day 14 unless otherwise noted. *P<0.05; **P<0.01; ***P<0.001.
Fig 5
Fig 5. Diminished myeloid output in Fzd6-/- mice correlates with a reduced parasite burden during the chronic phase of infection.
(A) Analysis of bone marrow myeloid subsets infected Fzd6-/- (KO) and Fzd6+/+ (WT) mice. Mean percentage for each cell subset is indicated within flow cytometry plots. Graphs show numbers of granulocytes and monocytes on day 14 and 28. See also S4, S6 and S7 Figs. (B) Numbers within flow cytometry plots indicate mean percentage of Ly6Clo/- F4-80+ bone marrow macrophages. Histograms show total numbers of macrophages and percent F4-80+ within Ly6Chi monocytes (mean + SEM from seven mice per group). (C) Ly6C and CCR expression (MFI) on Ly6Chi monocytes at day 28pi. (D) Percentage of CXCR4+, Sca-1+ and MHC-II+ cells within Ly6Chi monocytes on day 28pi. See also S8 Fig. (E) Percentage of Arginase-1 (Arg-1) and IL-10 expressing cells within Ly6Chi monocytes. (F) NOS2 expression (MFI) on Ly6Chi monocytes and Ly6Clo/- F4-80+ bone marrow macrophages at day 28pi. (G) Parasite burden determined by the limiting dilution assay in WT and KO bone marrow at day 28. Data shown were pooled from two independent infections with 10 mice per genotype. (H-I) Pearson's correlation coefficient was used to assess correlation between bone marrow parasite burden and bone marrow HSCs (H) and Ly6Chi monocytes (I) during the course of the infection. Data for correlation were pooled from C57BL/6, Fzd6+/+ and Fzd6-/- mice at day 14, 21 or 28. All bar graphs represent mean + SEM with 6 mice per group for day 28 and 3 mice per group for day 14 unless otherwise noted. Similar results were obtained from three independent experiments for day 28. *P<0.05; **P<0.01; ***P<0.001.
Fig 6
Fig 6. Decreased accumulation of myeloid cells is accompanied with reduced parasite burden in Fzd6-/- spleen.
(A) Analysis of myeloid subsets in the spleen of infected Fzd6-/- (KO) and Fzd6+/+ (WT) mice. Mean percentage for each cell subset is indicated within flow cytometry plots. See also S7, S8 and S9 Figs. (B) Graphs show numbers of granulocytes and monocytes on day 14 and 28. (C) F4-80+ cells within Ly6Chi monocytes and numbers of Ly6Clo/- F4-80+ macrophages in the spleen. (D) Parasite burden expressed as Leishmania Donovani Units (LDU) in spleen on days 14 and 28pi. (E) Ratio of splenic to bone marrow granulocytes and Ly6Chi monocytes in infected KO and WT mice on day 28 (mean + SEM from six mice per group). (F) Percentage of Sca-1+ and MHC-II+ cells within Ly6Chi monocytes on day 28pi. (G) Ly6C and CCR2 expression (MFI) on Ly6Chi monocytes at day 28pi. (H) Percentage of IL-10 expressing cells and NOS2 expression (MFI) on Ly6Chi monocytes at day 28pi. All bar graphs represent mean + SEM with 18 mice per group for day 28 pooled from three independent experiments and 3 mice per group for day 14 unless otherwise noted. *P<0.05; **P<0.01; ***P<0.001.
Fig 7
Fig 7. Fzd6-/- T lymphocytes are functionally indistinguishable from their Fzd6+/+ counterparts.
(A-B) Numbers of CD4+ and CD8+ T cells in BM (A) and spleen (B) of naïve and infected mice on day 28. (C-D) Cytokine production by bone marrow and spleen CD4+ T cells isolated from infected mice and stimulated ex vivo with parasite-pulsed bone marrow dendritic cells. Representative flow cytometry data are shown in (C). Graph in (D) shows compiled results from a representative experiment. See also S10 Fig. All bar graphs represent mean + SEM with 7 mice per group for day 28. (E) Macrophages derived from naïve Fzd6-/- (KO) and Fzd6+/+ (WT) bone marrow were either left untreated, stimulated with IFN-γ alone or first primed with IFN-γ and then infected with PKH26-labeled L. donovani amastigotes. See also S10 Fig. Imaging flow cytometry analysis of macrophages infected with fluorescent Leishmania parasites, showing multiple parasites within both Fzd6-/- (KO) and Fzd6+/+ (WT) macrophages. (F) Histograms represent percentage of infected macrophages and (G) parasite numbers in infected macrophages 72h post-infection. Low = 1–3, medium = 4–10, high = >10 parasites / cell. Bar graphs represent mean + SEM from two independent experiments.
Fig 8
Fig 8. Fzd6-/- bone marrow microenvironment is enriched in pro-inflammatory cytokines and chemokines.
(A) Fold change in cytokine/chemokine levels in Fzd6-/- (KO) and Fzd6+/+ (WT) bone marrow extracellular milieu on day 28pi as compared to untreated mice. Heatmap represents log 2 fold change in mean pixel density per cytokine/chemokine in at various time points of infection as compared to untreated mice. Each square represents one individual experiment coming from a pooled sample of 4–6 mice per group. (B) Interferon alpha levels in bone marrow supernatant obtained from naïve and infected mice.
Fig 9
Fig 9. Infected bone marrow microenvironment directly promotes HSPC expansion and the generation of permissive monocytes.
Freshly isolated lineage-depleted Fzd6+/+ (WT) BM cells were cultured in complete medium supplemented with 30% BM supernatant as indicated. (A) Representative flow cytometry data show the gating strategy for CD11b+, LSK and GMP populations. Graphs show numbers of cell recovered per 5x10⁵ cells seeded for each subset. Lin- Fzd6+/+ (WT) BM cells cultured with BM supernatant obtained from infected Fzd6-/- (KO) and Fzd6+/+ (WT) mice. See also S11 Fig. Data were pooled from three independent experiments. (B) Percentage of Ly6C+ monocytes in differentiation cultures following infection on day 4, and (C) the proportion of infected Ly6C+ monocytes after 24h and 72h. (D-E) Imaging flow cytometry analysis of monocytes infected with fluorescent Leishmania parasites, showing multiple parasites at (D) 24h and (E) 72h post-infection. Histograms represents parasite uptake in infected macrophages. Low = 1–3, medium = 4–10, high = >10 parasites respectively. Bar graphs represent mean + SEM from three independent experiments. *P<0.05; **P<0.01.

References

    1. Burberry A, Zeng MY, Ding L, Wicks I, Inohara N, Morrison SJ, et al. Infection mobilizes hematopoietic stem cells through cooperative NOD-like receptor and Toll-like receptor signaling. Cell Host Microbe. 2014;15(6):779–91. doi: 10.1016/j.chom.2014.05.004 ; - DOI - PMC - PubMed
    1. Boettcher S, Gerosa RC, Radpour R, Bauer J, Ampenberger F, Heikenwalder M, et al. Endothelial cells translate pathogen signals into G-CSF-driven emergency granulopoiesis. Blood. 2014;124(9):1393–403. doi: 10.1182/blood-2014-04-570762 ; - DOI - PMC - PubMed
    1. Manz MG, Boettcher S. Emergency granulopoiesis. Nature reviews Immunology. 2014;14(5):302–14. doi: 10.1038/nri3660 . - DOI - PubMed
    1. Baldridge MT, King KY, Boles NC, Weksberg DC, Goodell MA. Quiescent haematopoietic stem cells are activated by IFN-gamma in response to chronic infection. Nature. 2010;465(7299):793–7. Epub 2010/06/11. doi: 10.1038/nature09135 ; - DOI - PMC - PubMed
    1. Griseri T, McKenzie BS, Schiering C, Powrie F. Dysregulated hematopoietic stem and progenitor cell activity promotes interleukin-23-driven chronic intestinal inflammation. Immunity. 2012;37(6):1116–29. Epub 2012/12/04. doi: 10.1016/j.immuni.2012.08.025 ; - DOI - PMC - PubMed